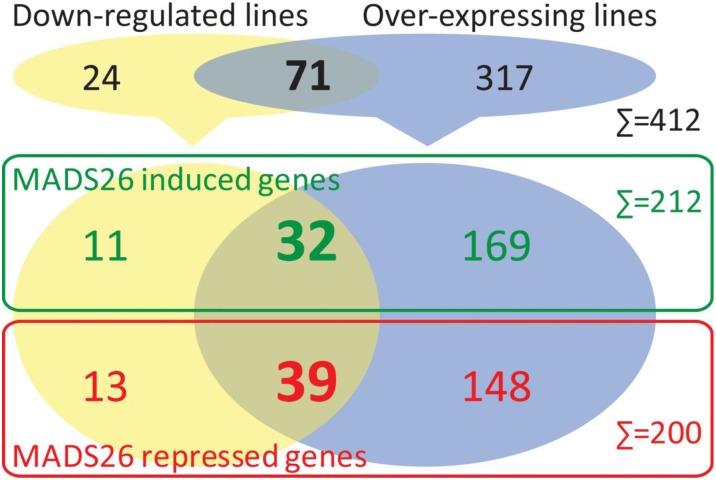
Figure 9.
Genome-wide gene expression regulations in OsMADS26-overexpressing or -down-regulated lines. Number of genes significantly differentially expressed in the microarray experiment; 71 (32 and 39, respectively) genes presented an inverted regulation profile in OX and DR lines. Green and red colors depict genes induced or repressed, respectively, by OsMADS26 expression.

