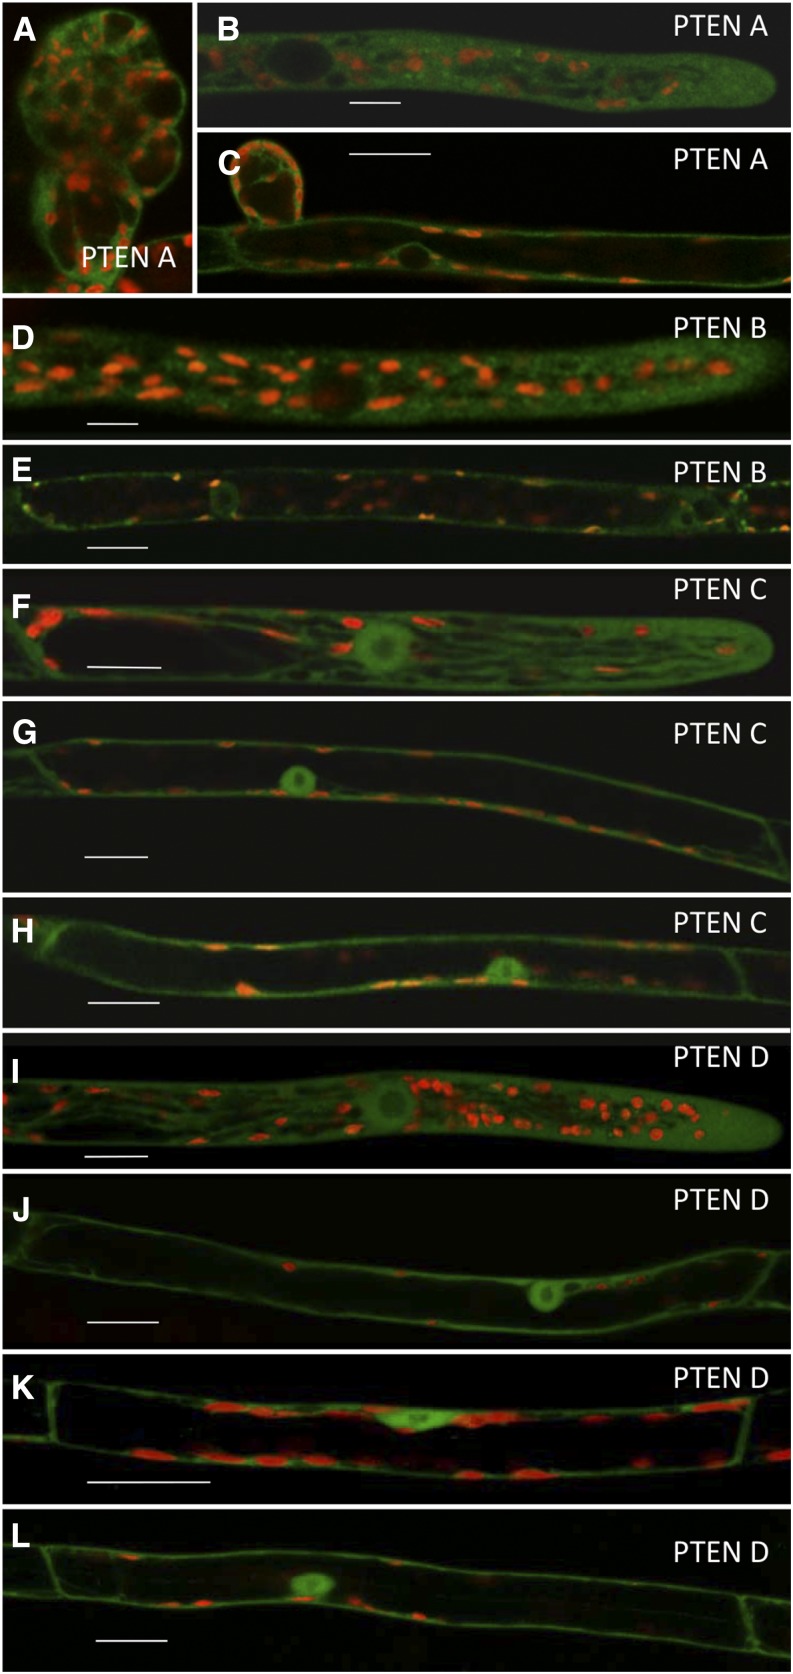
Figure 2.
Subcellular imaging of stable GFP-PpPTEN expression (under their endogenous promoter) in different developmental stages of the moss gametophytic phase. Red indicates chlorophyll autofluorescence. A to C, Confocal scanning laser microscopy (CSLM) imaging of PTENA in developing bud (A), rhizoid apical cell (B), and caulonemal subapical cell (C). D to E, CSLM imaging of PTENB in rhizoid apical (D) and subapical cell (E). F to H, CSLM imaging of PTENC in rhizoid apical (F) and subapical cell (G) and in caulonemal subapical cell (H). I to L, CSLM imaging of PTEND in rhizoid apical (I) and subapical cell (J), chloronema subapical cell (K), and caulonemal subapical cell (L). Bar = 20 μm.

