Figure 5.
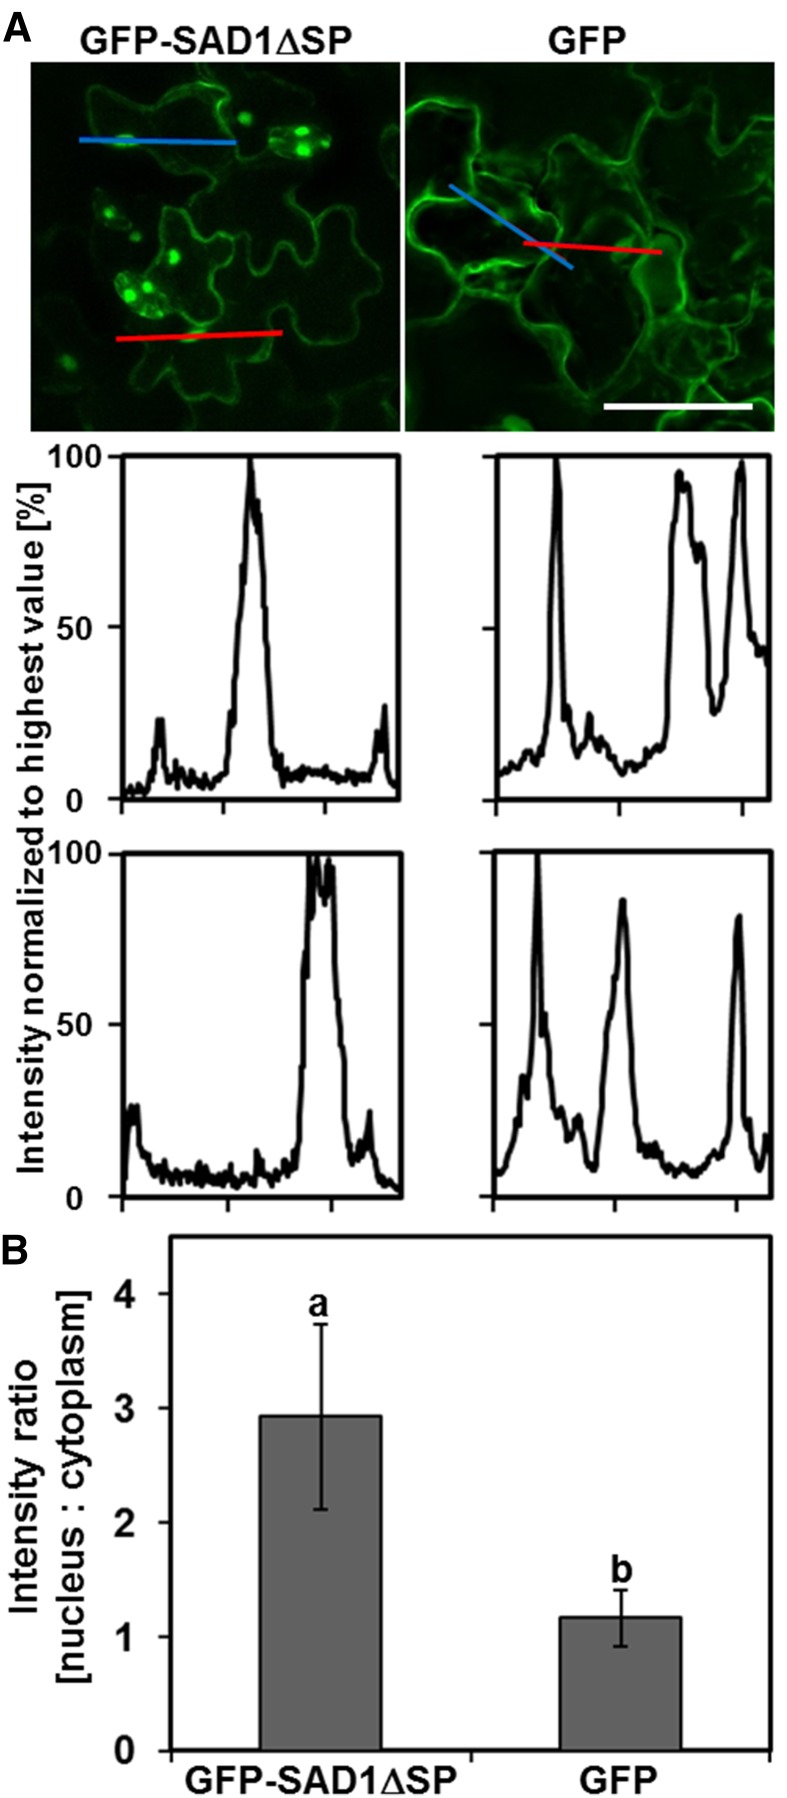
Heterologously expressed GFP-SAD1ΔSP fusion protein accumulates in the nuclei of Arabidopsis cells. A, Fluorescence signals of plants expressing GFP-SAD1∆SP (top left) or GFP (top right). Red and blue colored lines indicate two examples for regions of fluorescence intensity measurements. Intensity measurements (middle and bottom) show GFP signal accumulation in the nucleus (middle peak) of plants expressing GFP-SAD1∆SP (bottom left) or GFP (bottom right) along the red (middle) or blue (bottom) region of interest indicated in top. B, Quantification of GFP intensity ratios between nucleus and cytoplasm of leaf cells from Arabidopsis plants expressing GFP-SAD1∆SP or GFP. Cells expressing the GFP-SAD1∆SP fusion protein show an average signal intensity ratio of nucleus:cytoplasm of about 3:1. Cells expressing GFP show a ratio of 1:1; n = 35 cells for GFP-SAD1∆SP, and n = 40 cells for GFP. Five different plants were analyzed for each construct. Error bars show sd. Letters above the data indicate statistically significant differences (P ≤ 0.001). Bars = 50 µm.

