Figure 6.
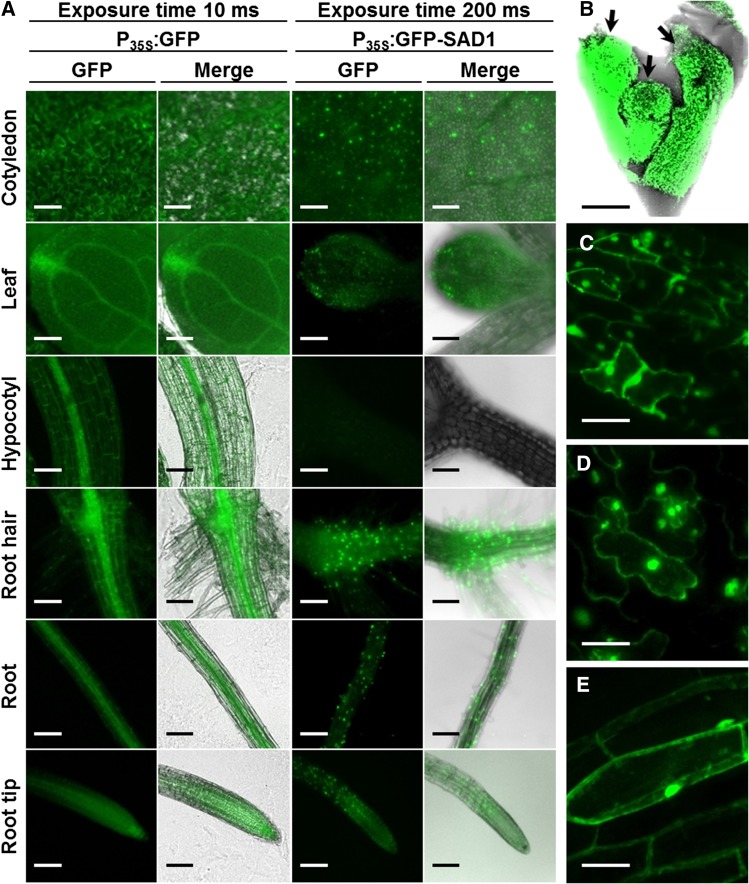
Microscopic overview of GFP-SAD1ΔSP distribution in transgenic Arabidopsis plants. A, Twelve-day-old Arabidopsis plants expressing GFP (left) or GFP-SAD1∆SP (right). Pictures were taken with an exposure time of 10 (left) or 200 ms (right). Plants expressing GFP show a fluorescence signal in every part of the plant. GFP-SAD1∆SP was not detected in hypocotyls. B, Fluorescence microscopic picture of three floral buds (arrows) of Arabidopsis expressing GFP-SAD1∆SP. C to E, GFP fluorescence of GFP-SAD1ΔSP expressed in petal cells of the flower (C), leaves (D), and root cells (E) of 6-week-old plants. Fluorescence is observed in the nucleus and the cytoplasm. Bars = 100 µm (A and B) and 25 µm (C–E).

