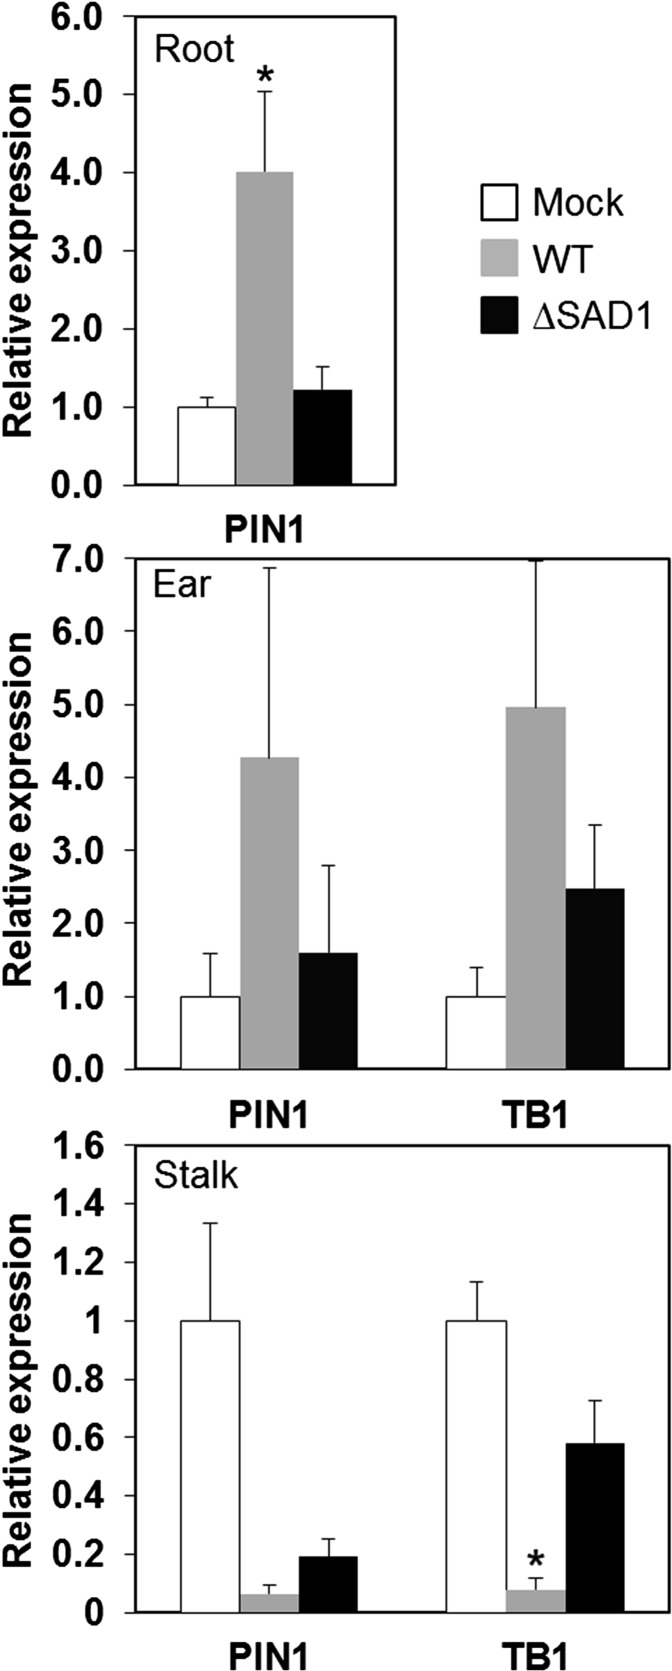
Figure 7.
Real-time PCR analysis of PIN1 and TB1 transcript abundance. Gene expression was measured in roots (top), ears (middle), and stalks (bottom) of maize inoculated with water (mock) wild-type (WT) and ∆SAD1 (ΔSAD1) deletion strains of S. reilianum. Values given are expression values relative to mock-inoculated plants and means of three biological replicates with pools of three plants per replicate and tissue ± sem. *, Statistical difference to both mock and ΔSAD1 inoculations within the same tissue (P value < 0.05).

