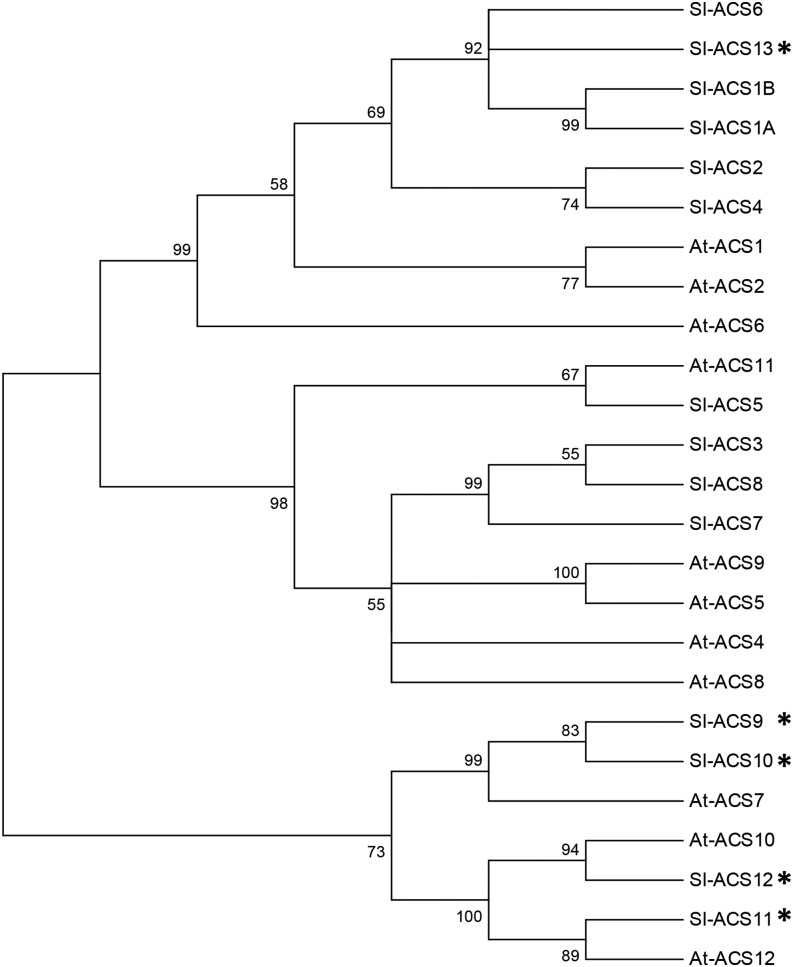
Figure 2.
Phylogenetic tree of tomato and Arabidopsis ACS. The phylogenetic tree was inferred using the neighbor-joining method. The optimal tree with the sum of branch length = 3.82205137 is shown. The percentage of replicate trees in which the associated taxa clustered together in the bootstrap test (1,000 replicates) is shown next to the branches. The evolutionary distances were computed using the Poisson correction method and are the number of amino acid substitutions per site. The analysis involved 25 amino acid sequences. All positions containing gaps and missing data were eliminated. There were a total of 138 positions in the final data set. Phylogenetic trees were conducted in MEGA7. *, New tomato ACS genes identified in the current study.

