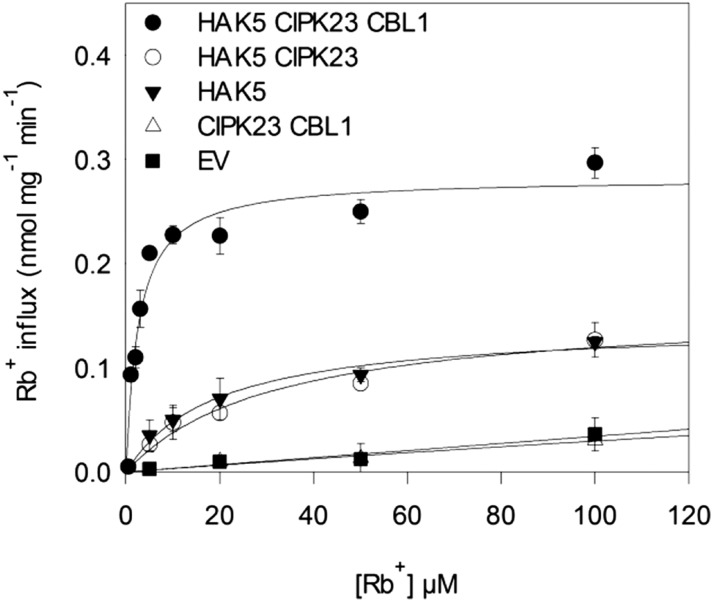
Figure 2.
Initial rates of Rb+ uptake in yeast cells expressing HAK5, CIPK23, and CBL1. Cells of trk1 trk2 genotype transformed with the empty vector (EV; black squares), CIPK23/CBL1 (white triangles), HAK5 (black triangles), HAK5/CIPK23 (white circles), or HAK5/CIPK23/CBL1 (black circles) were grown overnight in AP medium supplemented with 5 mm K+. After 6 h of K+ starvation, cells were suspended in assay buffer supplemented with different Rb+ concentrations. Initial rates of Rb+ uptake were determined and plotted against the corresponding Rb+ concentrations. Data were fitted to Michaelis-Menten equations and the Km and Vmax values calculated. Data represent the average of at least three repetitions, and error bars denote se.

