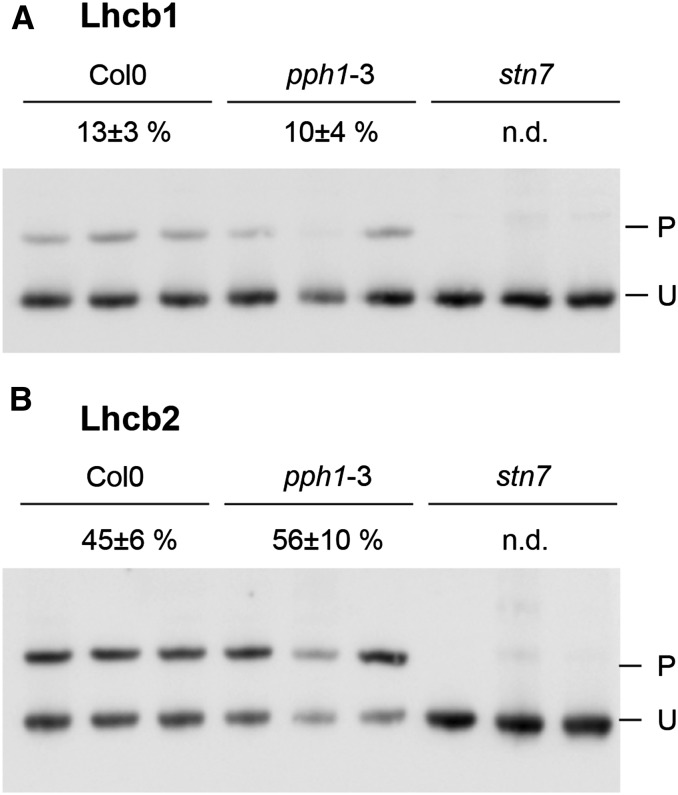
Figure 2.
Lhcb phosphorylation in white light. Total protein from mature leaves of 6-week-old plants was subjected to two-layer Phos-tag PAGE. Three biological replicates are shown for each genotype. Wild-type Col0 (ecotype Columbia 0) plants are compared with the phosphatase mutant pph1-3 and the kinase mutant stn7. The measured level of phosphorylation is indicated for each genotype above the immunoblots with the sd (n = 5; n.d., <1% of phosphorylation). P and U indicate the phosphorylated and unphosphorylated forms, respectively. A, Immunodetection of Lhcb1. B, Immunodetection of Lhcb2.

