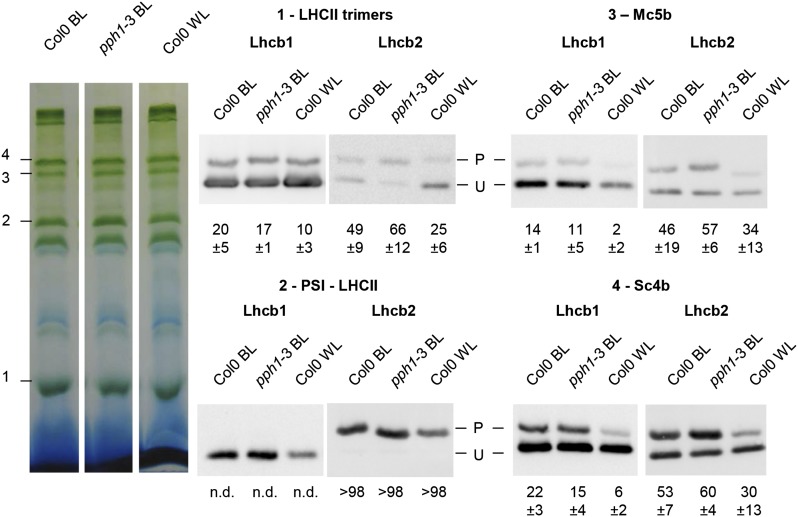
Figure 5.
Quantification of Lhcb1 and Lhcb2 phosphorylation in supercomplexes. Wild-type Col0 (ecotype Columbia 0) and mutant pph1-3 plants were treated for 1 h with far-red light and then exposed to blue light for 30 min (BL). Wild-type Col0 were also grown under white light (70 μmol sec−1 m−2) and harvested 4 h after the onset of light (WL). Thylakoid membrane complexes extracted with digitonin were subjected to BN-PAGE. Individual bands were cut as indicated on the left (1–4) and separately analyzed by two-layer Phos-tag PAGE and immunoblotting. The measured percentage of phosphorylation is indicated below each lane with its sd (n = 3). n.d., <1% phosphorylation.

