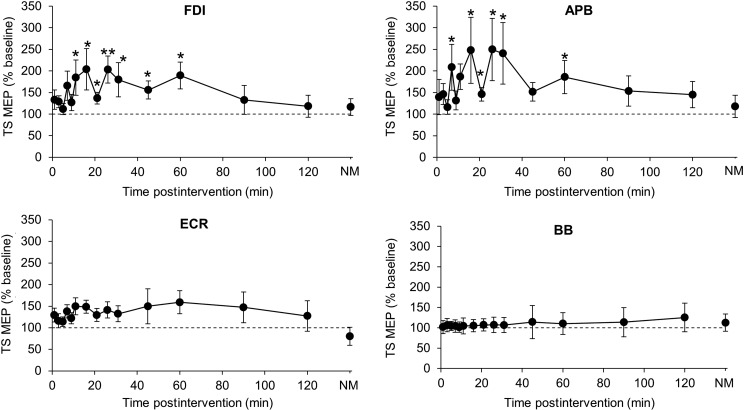
Figure 8.
Topographic specificity of MEP amplitude changes postintervention. Comparison of the percentage change (compared with baseline) in single-pulse MEP amplitude 1–120 min and the next morning (NM) after intervention delivered at OPT to FDI hotspot, shown for FDI, APB, ECR, and BB muscles. LMM indicated a significant effect of time in FDI and APB, but not ECR or BB. Data are means ± SEM. *P < 0.05; **P < 0.01 (post hoc t-tests, significant difference of TS MEP amplitude from baseline).

