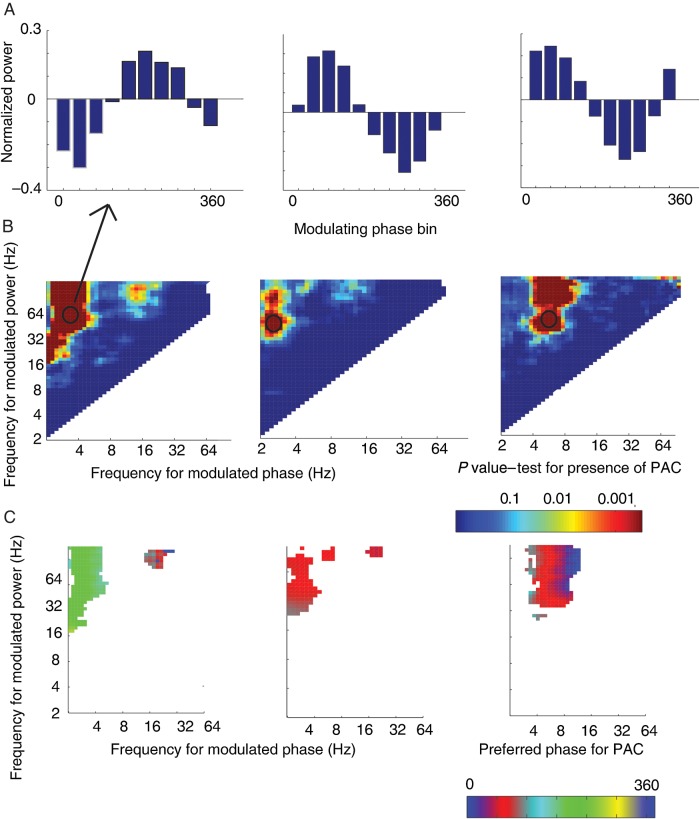
Figure 2.
Identification of phase–amplitude coupling (PAC). (A) Mean normalized power values across 10 phase bins for a single frequency (modulating phase)–frequency (modulated amplitude) step. This same analysis was performed at each step in the spectrum. (B) Summary graph for all frequency–frequency steps showing the P-value at each step from the permutation procedure detecting significant PAC. Left and center plots show a concentration of effect in the slow-theta band (for gamma modulation) while the plot in right-hand column shows 4–9 Hz theta modulation of gamma band power. Circle indicates the pair from which the binned power values (shown in the top row) were drawn. (C) Preferred phase for PAC as determined by circular regression. Phase values for frequency–frequency pairs with significant PAC are plotted. Preferred phase is conserved across significant pairs within the frequency band.

