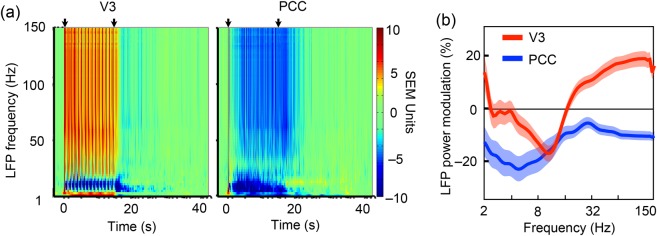
Figure 2.
(a) LFP power modulation relative to baseline (0–5 s before stimulus onset) in standard error units (SEM is estimated based on baseline activity). Arrows indicate stimulus onset and offset. Data from 607 and 605 trials are included for V3 (left) and PCC (right), respectively. (b) LFP power modulation (mean ± SEM) as a function of frequency (log) during stimulation for V3 and PCC.

