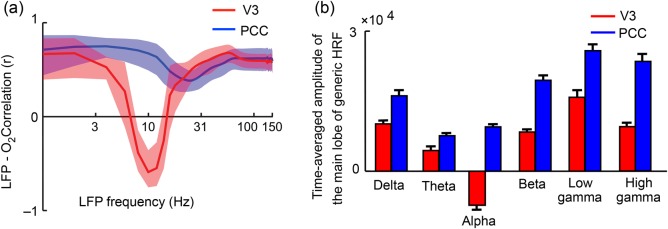
Figure 6.
(a) A linear correlation (mean ± SEM) between oxygen and LFP responses at each frequency. Correlations were computed at lags from −5 to +12 s, and the highest correlation at each frequency is shown. (b) The amplitude (mean ± SEM) of the main lobe of generic HRFs in V3 and PCC at each of 6 frequency bands. Generic HRF was calculated for each data session, and the main lobe was defined as the lobe with the larger deviation from baseline. For all 6 bands, the amplitude of the main lobe of generic HRFs are significantly different in the 2 areas.

