Figure 1.
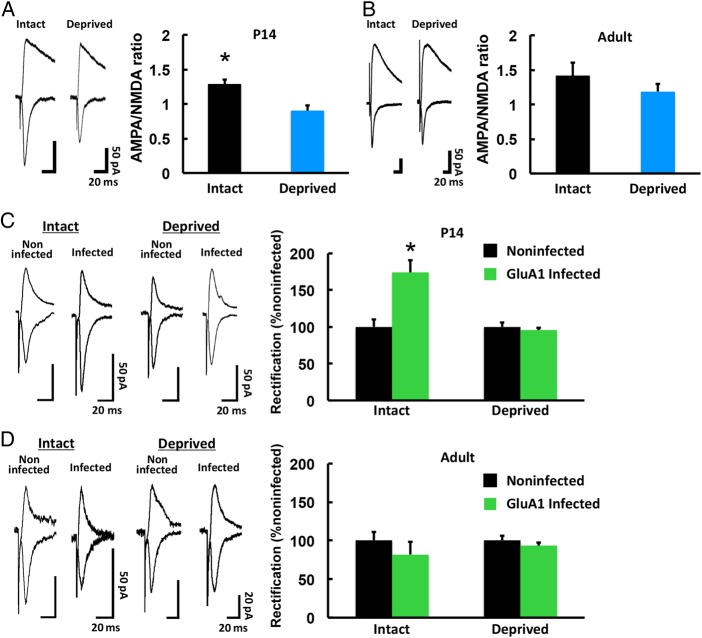
Experience-driven synaptic AMPAR delivery is limited in the adult barrel cortex. (A) (Left) Synaptic responses at layer 4–2/3 synapses in the barrel cortex of developing (P14) WT mice with (Intact) and without (Deprived) whiskers. Scale bars: 50 pA, 20 ms. (Right) Mean ratio of AMPAR-mediated currents to NMDA receptor-mediated currents (A/N ratio). Intact: n = 5 (11 cells from 5 animals); Deprived: n = 5 (10 cells from 5 animals). *P < 0.05. (B) Synaptic responses at layer 4–2/3 synapses in the barrel cortex of adult (3-month-old) WT mice with (Intact) and without (Deprived) whiskers. Scale bars: 50 pA, 20 ms. (Right) Mean A/N ratio. Intact: n = 6 (17 cells from 6 animals); Deprived: n = 5 (13 cells from 5 animals). (C) (Left) Synaptic responses from neurons infected with Herpes simplex virus expressing GFP-GluA1 and from noninfected neurons (held at −60 mV and +40 mV, as indicated) at layer 4–2/3 synapses in the barrel cortex of P14 WT mice with (Intact) and without (Deprived) whiskers. The AMPAR-mediated responses were isolated by the application of 0.1 mM APV. Scale bars: 50 pA, 20 ms. (Right) Average rectification indices (RI; response at −60 mV/response at +40 mV) of neurons expressing GFP-GluA1 (green), normalized to the RI value of nearby noninfected cells (black). Intact: n = 5 (10 infected cells and 10 noninfected cells from 5 animals); Deprived: n = 5 (10 infected cells and 10 noninfected cells from 5 animals). *P < 0.05. (D) (Left) Synaptic responses from neurons infected with Herpes simplex virus expressing GFP-GluA1 and from noninfected neurons at layer 4-2/3 synapses in the barrel cortex of adult WT mice with (Intact) and without (Deprived) whiskers. Scale bars: 20 pA, 20 ms. (Right) Average RI of neurons expressing GFP-GluA1 (green), normalized to the RI value of nearby noninfected cells (black). Intact: n = 6 (6 infected cells and 6 noninfected cells from 6 animals); Deprived: n = 4 (8 infected cells and 8 noninfected cells from 4 animals). Data were analyzed by Student's t-test. Data are presented as mean ± SEM.

