Figure 5.
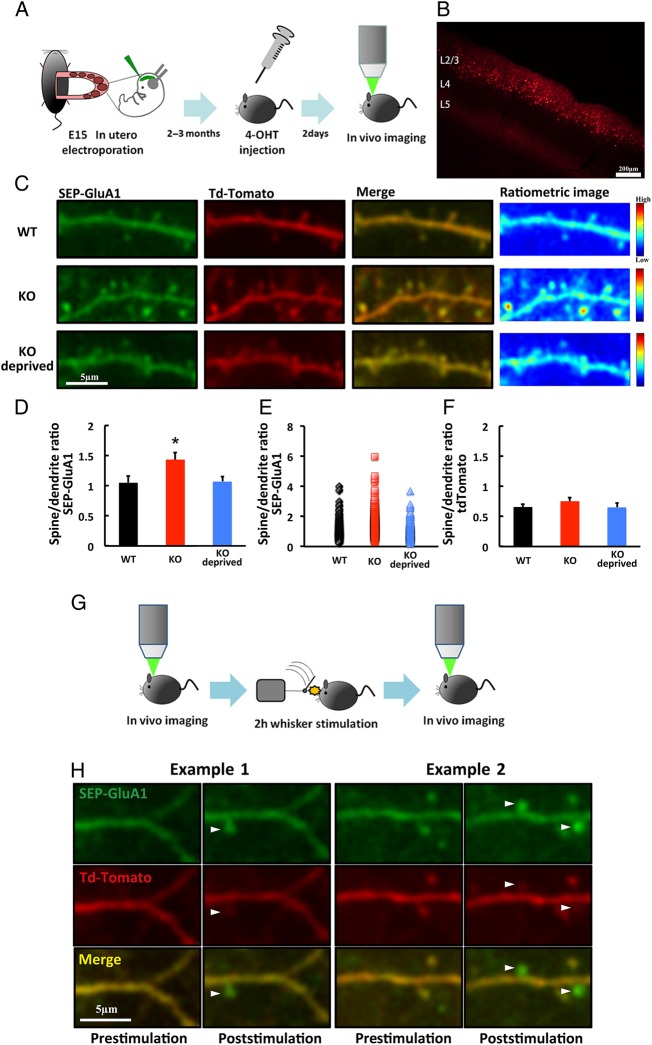
Surface accumulation of AMPAR is increased at spines in layer 2/3 of the adult barrel cortex of NgR1-deficient mice. (A) Schematic of the SEP-GluA1 and tdTomato expression and in vivo imaging. (B) Example of transfected neurons in layer 2/3 of the barrel cortex. Scale bar: 200 µm. (C) Examples of SEP-GluA1- and tdTomato-expressing neurons or pseudo-color ratiometric heat maps of the SEP-GluA1 intensity in adult WT mice and NgR1-deficient mice with (KO) and without (KO deprived) whiskers. Scale bar: 5 µm. (D) Ratio of fluorescence intensity in spines to dendritic shaft for SEP-GluA1 in adult WT mice and NgR1-deficient mice with (KO) and without (KO deprived) whiskers. WT: n = 7 (376 spines 7 animals); KO: n = 7 (403 spines from 7 animals); KO deprived: n = 5 (309 spines from 5 animals). *P < 0.05 KO versus WT and KO versus KO deprived. (E) Scatter plot of spine-to-dendrite SEP-GluA1 ratios in adult WT mice and NgR1-deficient mice with (KO) and without (KO-deprived) whiskers. (F) Ratio of fluorescence intensity in spines to dendritic shaft for tdTomato in WT mice, and in NgR1-deficient adult mice with (KO) and without (KO deprived) whiskers. WT: n = 7 (376 spines 7 animals); KO: n = 7 (403 spines from 7 animals); KO deprived: n = 5 (309 spines from 5 animals). (G) Schematic of the in vivo imaging of animals with 2 h of whisker stimulation. (H) Examples of the surface accumulation of GluA1 on newly synthesized spines of adult NgR1-deficient mice after 2 h of whisker stimulation (arrowheads). Scale bar: 5 µm. Data in D, F were analyzed by one-way ANOVA followed by post hoc Fisher's Least Significant Difference (LSD). Data are presented as mean ± SEM. Representative images shown in the figures were Gaussian filtered.

