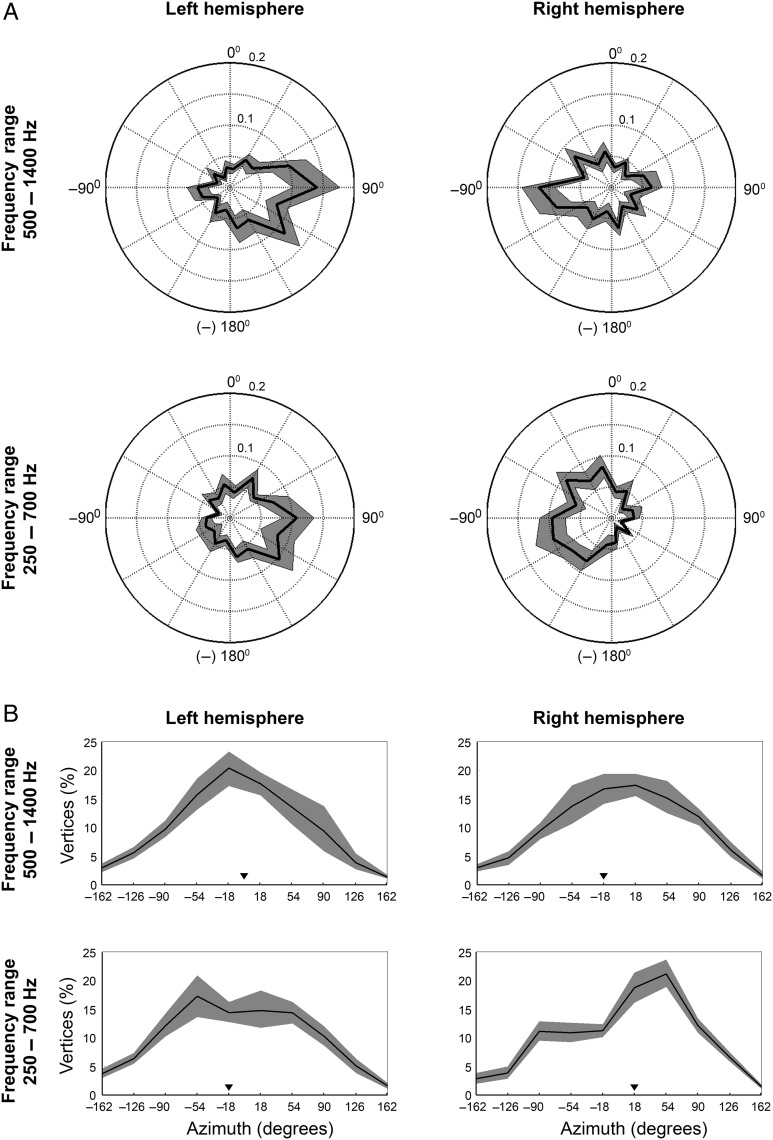
Figure 2.
A preference for contralateral azimuth positions and steepest slopes located mostly near frontal midline. (A) Plotted are the average distributions of azimuth preference per hemisphere and frequency condition across RAFs of all participants. The angular dimension signals the azimuth position of the stimulus; the radial dimension signals the proportion of vertices exhibiting a directional preference for each azimuth position tested (black line). The shaded gray area indicates the 95% confidence interval (estimated with bootstrapping, 10 000 repetitions). (B) Plots show the average distribution of steepest slope location on the azimuth across the RAFs of all participants. We included either the steepest positive slope (for ipsilaterally tuned vertices) or negative slopes (for contralaterally tuned vertices). The black line indicates the average proportion of steepest slopes per azimuth position. Black triangles signal the median of the distribution. The shaded gray area again indicates the 95% confidence interval (estimated with bootstrapping, 10 000 repetitions).

