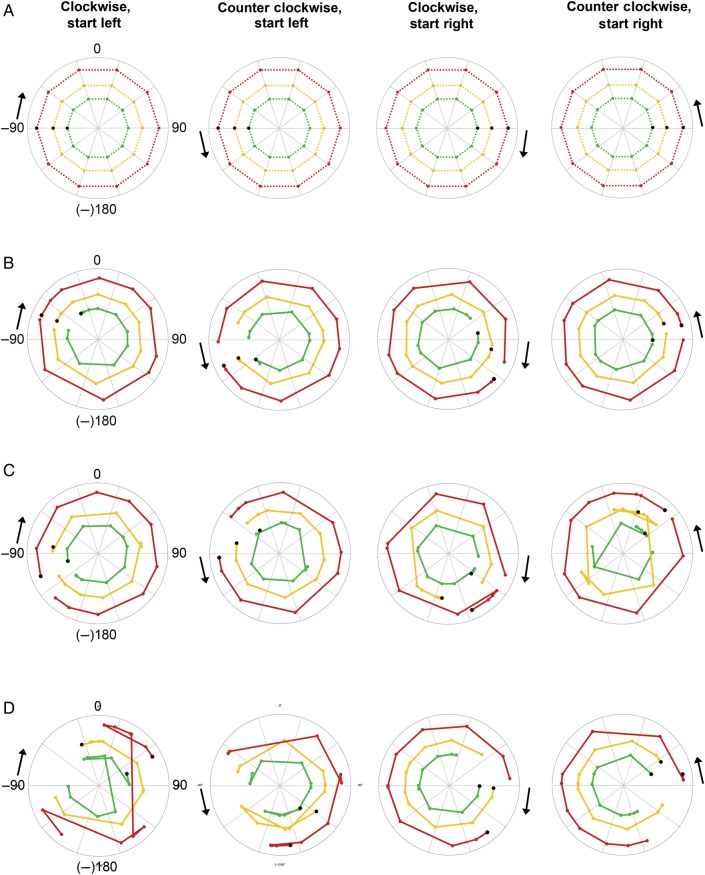
Figure 7.
Decoding sound azimuth from FM tones (range 250–700 Hz). (A) Each polar plot shows the known sound azimuth position over time modeled with a bilateral, two-channel code. Black arrows indicate starting point of the sound (left or right) and motion direction (clockwise or counter clockwise). Colored dots indicate the position of the sound every 36° or 2 s, that is, at every measured time point. Black dots indicate the starting position, that is, the first time point measured. Colored dotted lines connect the measured time points and indicate the azimuthal trajectory of the sound in the various sound intensity conditions: red corresponds to loud intensity, yellow to medium intensity and green to soft intensity. Note that the radius in these plots is arbitrary and was selected to create nonoverlaying azimuthal trajectories for ease of visualization. (B) Polar plots show the azimuth position decoded from the measured BOLD response in both hemispheres with a bilateral, two-channel opponent population code. The closer the decoded trajectory resembles the known azimuth trajectory shown in (A), the higher the decoding accuracy. (C) Here, azimuth position is decoded from the measured BOLD response in the left hemisphere with a unilateral, local population coding model. (D) Same as for C but for the right hemisphere.

