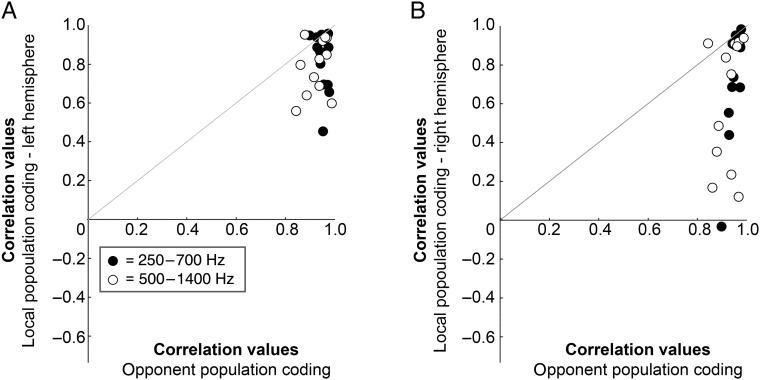
Figure 8.
Decoding accuracy of the opponent channel coding model is higher than single-channel coding. (A) Plotted against each other are the correlations between the outcome of the bilateral, opponent population coding model and the actual azimuth position of the sound (x-axis), and between the outcome of a unilateral, single-channel coding model (left hemisphere, y-axis). Black dots represent correlations for the sounds in the 250–700 Hz frequency range, white dots for the 500–1400 Hz frequency range. Within each frequency range, each dot represents the correlation value for one of the conditions tested in this study (12 in total), e.g., soft intensity, starting left, moving clockwise. Dots above the gray diagonal indicate a higher correlation for the local population coding model than for the opponent population coding model. Values below the gray diagonal indicate the opposite.

