
Fig. 2.
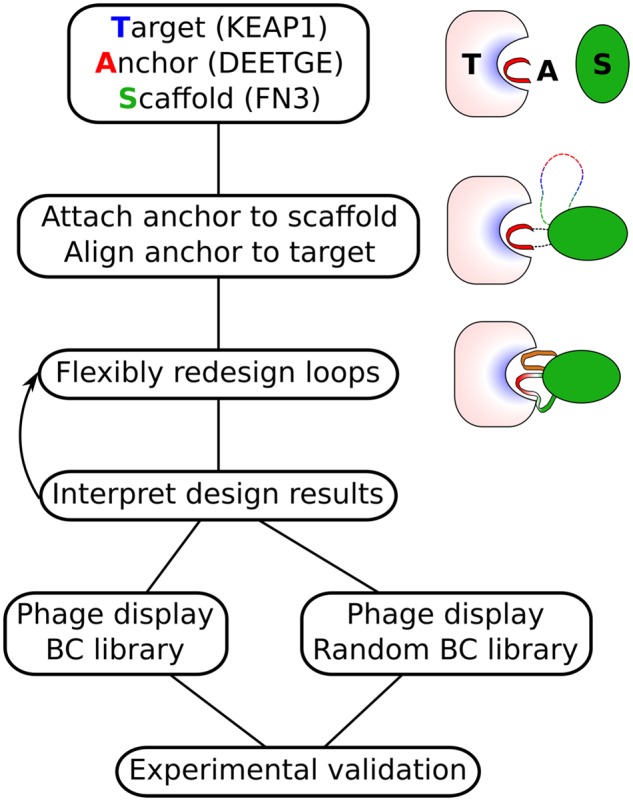
Protocol flow chart. This flow chart outlines the combined computational and experimental protocol used to identify tight binders to KEAP1. See also the Supplementary Methods for command lines. At the top are two steps performed inside the AnchoredPDBCreator protocol. In the middle are steps performed in the AnchoredDesign protocol. Note that the middle step loops on itself. Here, we performed two cycles of the AnchoredDesign modeling. The bottom portion represents data analysis and translation of modeling results into phage display libraries, followed by experimental validation.