
FIGURE 2:
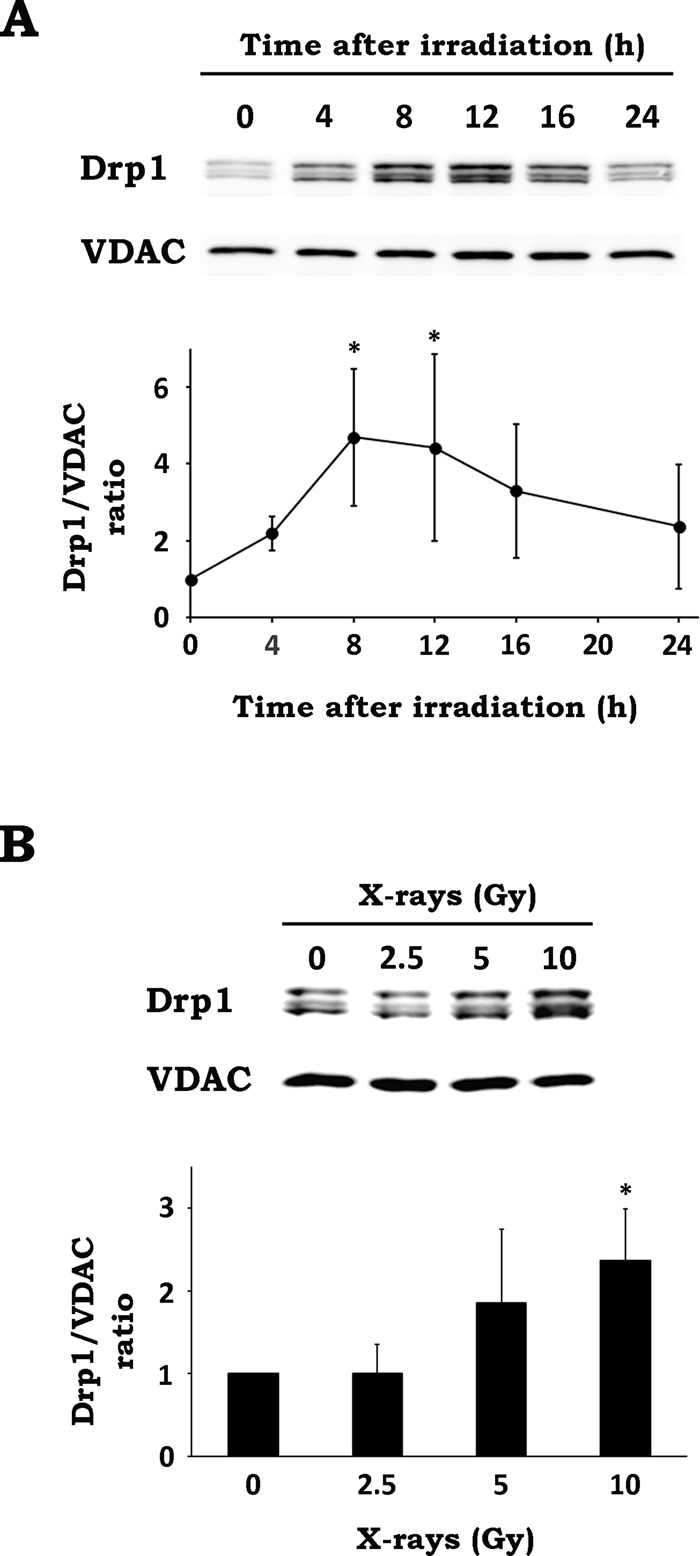
IR stimulates Drp1 translocation. (A) After x-irradiation at 10 Gy, WT MEF cells were cultured for the indicated times. After incubation, organelle fractions containing mitochondria were isolated and analyzed by Western blotting. Top, representative blots of Drp1 and VDAC. Bottom, time-course analysis of Drp1 translocation. The intensities of Drp1 bands were normalized to those of VDAC bands. Data are expressed as means ± SD of five experiments. *p < 0.05 vs. 0 h (Dunnett test). (B) After x-irradiation at the indicated doses, WT MEF cells were cultured for 12 h. After incubation, organelle fractions containing mitochondria were isolated and analyzed by Western blotting. Top, representative blots of Drp1 and VDAC. Bottom, dose–response analysis of Drp1 translocation. Data are expressed as means ± SD of four experiments. *p < 0.05 vs. 0 Gy (Dunnett test).