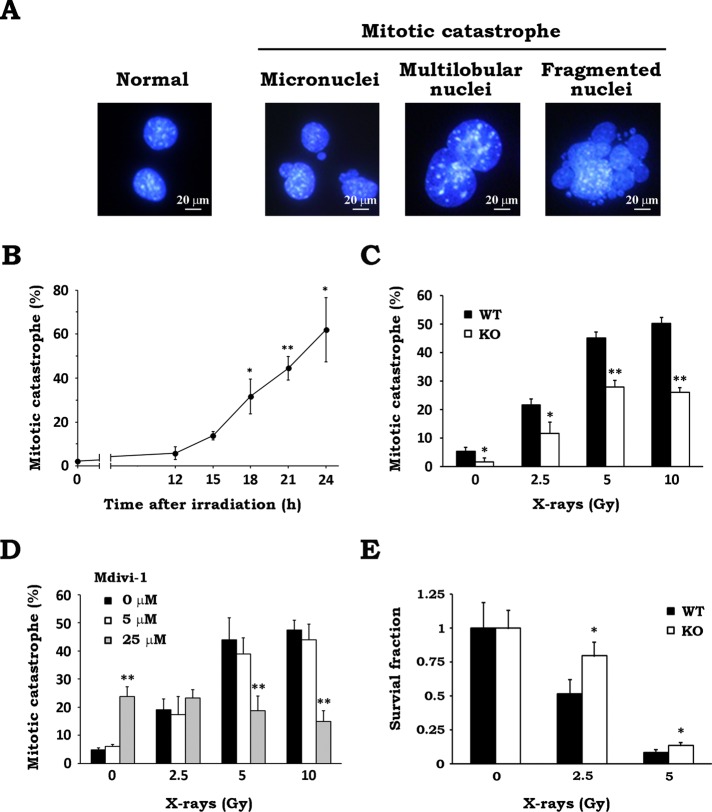
FIGURE 4:
Drp1 inhibition attenuates radiation-induced MC and increases cellular survival after x-irradiation. (A) Cells undergoing MC after x-irradiation. After WT MEFs were x-irradiated at 10 Gy and incubated for 24 h, cell nuclei were stained with 300 nM DAPI. Representative images of the cells with features of aberrant mitotic nuclei such as micronuclei, multilobular nuclei, and fragmented nuclei. (B) Time course of MC induction after irradiation. WT MEFs were cultured for the indicated times after x-irradiation at 10 Gy. After incubation, nuclear morphology of the irradiated cells was analyzed. At least 200 cells were counted, and the percentage of cells undergoing MC was determined. Data are expressed as means ± SD of three experiments. *p < 0.05 and **p < 0.01 vs. 0 h (Dunnett test). (C) Effect of Drp1 deficiency on radiation-induced MC. After x-irradiation at the indicated doses, WT (black) and KO (white) MEFs were cultured for 24 h. MC was scored as described. Data are expressed as means ± SD of three experiments. *p < 0.05 and **p < 0.01 vs. WT (Student’s t test). (D) Effect of Mdivi-1 on radiation-induced MC. After x-irradiation at the indicated doses in the presence of 0 (black), 5 (white), or 25 (gray) μM Mdivi-1, WT MEFs were cultured for 24 h. MC was scored as described. Data are expressed as means ± SD of three experiments. **p < 0.01 vs. 0 μM Mdivi-1 (Student’s t test). (E) Effect of Drp1 deficiency on clonogenic survival after x-irradiation. After x-irradiation at the indicated doses, WT (black) and KO (white) MEFs were cultured for 7 d. Colonies containing >50 cells were scored as surviving cells. Survival fractions were calculated as described in Materials and Methods. Data are expressed as means ± SD of three experiments. *p < 0.05 vs. WT (Student’s t test).

