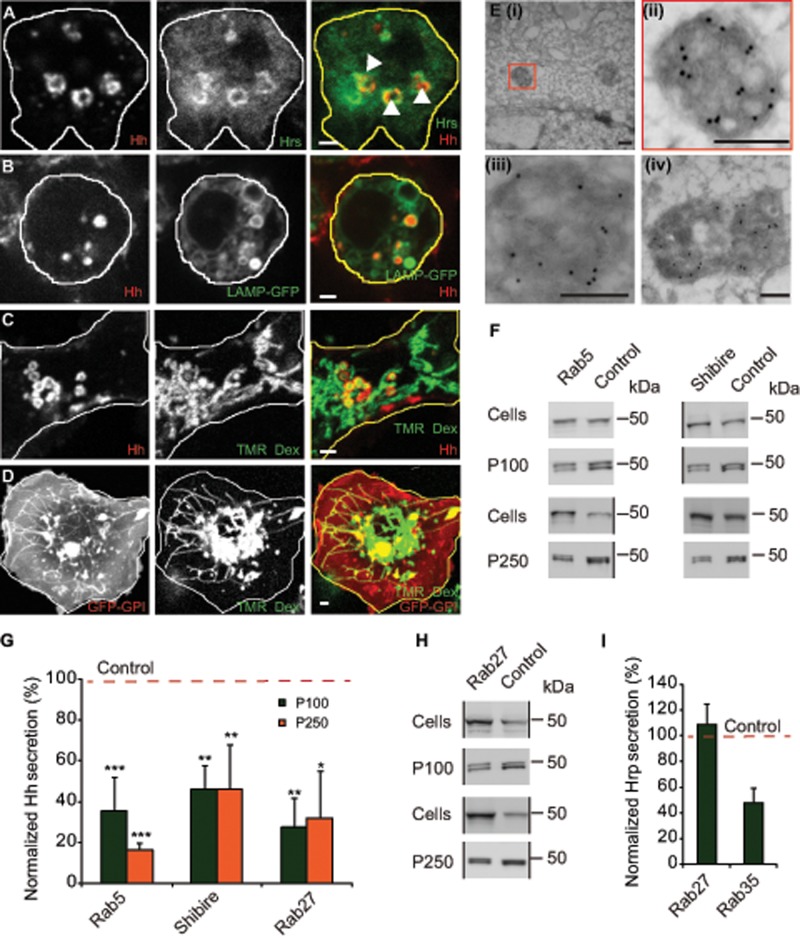
FIGURE 3:
Accumulation of Hh on ILVs inside MVBs is necessary for its exovesicular secretion. (A) HhGFP-transfected S2R+ cells labeled with an endocytic pulse (2 h) of A647–anti-GFP Fab (left; red in merge) to localize endocytosed Hh and immunostained with anti-Hrs (middle; green in merge). A single confocal slice (for a 3D projection, see Supplemental Video S1). Note that A647–anti-GFP Fab staining is detected in enlarged endosomal organelles decorated with Hrs (arrowheads). Scale bar, 2 μm. (B, C) S2R+ cells were cotransfected with HhmCFP and LAMP-GFP (B) or with HhmCFP alone (C) and 2 d later incubated with A647–anti-GFP Fab singly for 20 min (B) or along with TMR-Dex for 2 h to localize organelles accessed by endocytic probes and imaged using a PerkinElmer spinning-disk confocal microscope (B) or an Olympus FV1000 confocal microscope (C). Images represent a single confocal slice (for a 3D projection of the cells, see Supplemental Video S2). Note that endocytosed Hh (left; red in merge) colocalizes with vesicular LAMP-GFP (B; middle; green in merge) and with TMR-Dex (C; middle; green in merge) only in vesicular compartments but is segregated from tubular structures representing lysosomes marked by tubular TMR-Dex. Scale bar, 2 μm. (D) Unlike Hh-mCFP, endocytosed GFP-GPI (single confocal slice) visualized with a 2-h endocytic pulse of A647–anti-GFP Fab and imaged using an FV1000 confocal microscope is visualized in both tubular and vesicular structures of GFP-GPI–expressing S2R+ cells. Scale bar, 2 μm. (E) Immuno-EM on frozen sections from S2R+ cells transfected with HhGFP show labeling on the ILVs inside the MVB lumen, detected using the anti-Hh antibody and probed using 10-nm protein A–gold. (ii) Zoomed image of the MVB marked in (i); (iii, iv) other representative images of MVBs from different sections. Scale bar, 200 nm. (F, G) Western blots (F) show the amount of HhGFP in the corresponding cellular (Cells) and secreted fractions (P100, P250) obtained from HhGFP-transfected S2R+ cells treated with control (Zeocin) or with indicated RNAi after being subjected to the same sedimentation scheme shown in Figure 1A. Black vertical lines denote deletion of other lanes from the blots containing biological replicates of the same experiment. (G) Bar graph shows the extent of reduction in the amount of secreted HhGFP in P100 and P250 fractions (represented as percentage reduction in normalized secretion with respect to control; red dashed line) in the indicated RNAi treatment determined after quantifying the density of the staining in the Western blots. Nonsaturating exposures of cellular, P100, and P250 fractions were used for intensity measurements, and values in P100 and P250 fractions were normalized to the values in cell lysates. Data from at least three independent experiments are expressed as mean ± SD; *p < 0.05, **p < 0.01, ***p < 0.001. (H) Western blots reflect the amount of HhGFP in the cellular (Cells) and secreted (P100, P250) fractions derived from HhGFP-transfected S2R+ cells treated with control and dRab27 RNAi. Black vertical lines denote deleted regions from the blot. Deleted lanes had biological replicates and samples described elsewhere (Vps28 RNAi; Figure 6F). (I) Bar graph showing extent of secretion of ss-HRP expressed in S2R+ cells transfected with pMT-ss-HRP and treated with indicated RNAi compared with control RNAi (red dashed line). Data from two independent experiments. Note the extent of reduction in ss-HRP secretion in dRab35 RNAi treatment vs. the lack of any change in dRab27.

