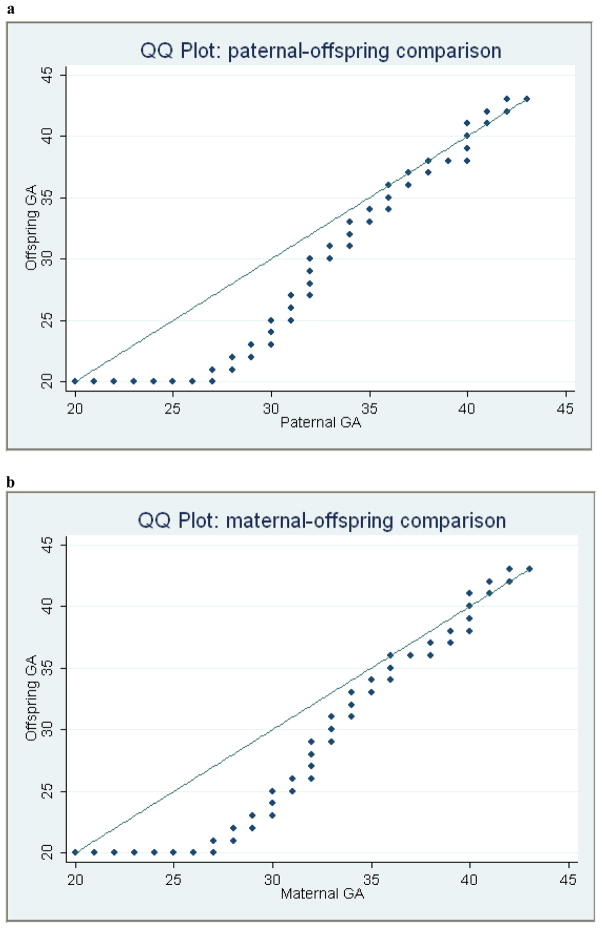
Figure 1. Quantile-Quantile (QQ) plots for gestational age (GA) across two generations.
(a) Paternal GA versus offspring GA. (b) Maternal GA versus offspring GA. In both panels, GA in the parent is represented on the x- axis and GA of the offspring on the y-axis. Each dot represents the value of (x,y) for different cumulative percentiles. The diagonal line represents the expected y = x relationship. Both the paternal and maternal plots show skewing below the diagonal, resulting in a bias towards individuals with larger GA as parents.

