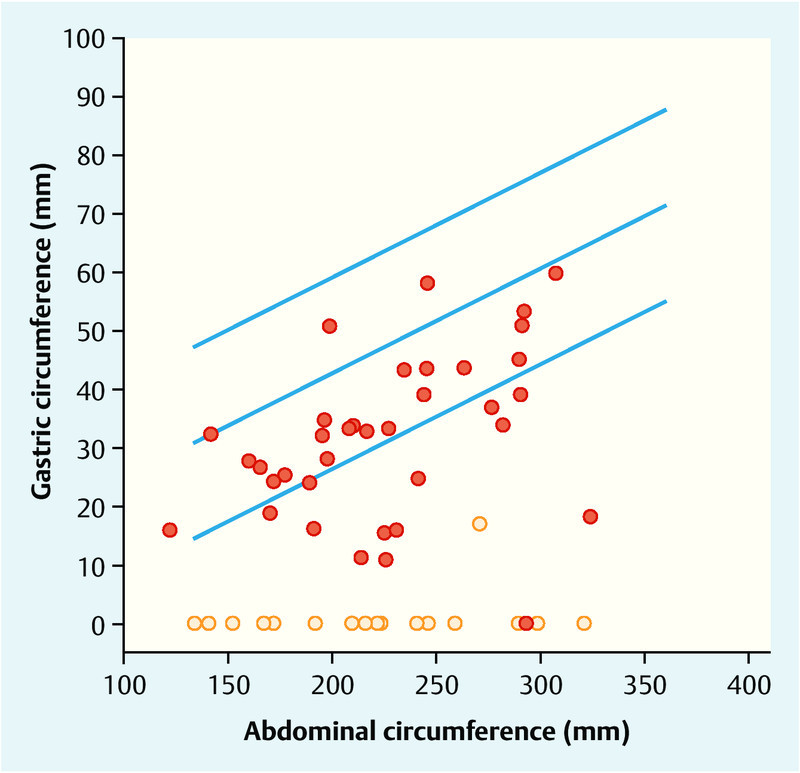
Fig. 2.

Graphic presentation of the normal distribution of gastric circumference in dependence on abdominal circumference including the 5th and 95th percentiles. The points show the gastric circumference values of foetuses with OA (red dots with fistula, orange dots without fistula).
