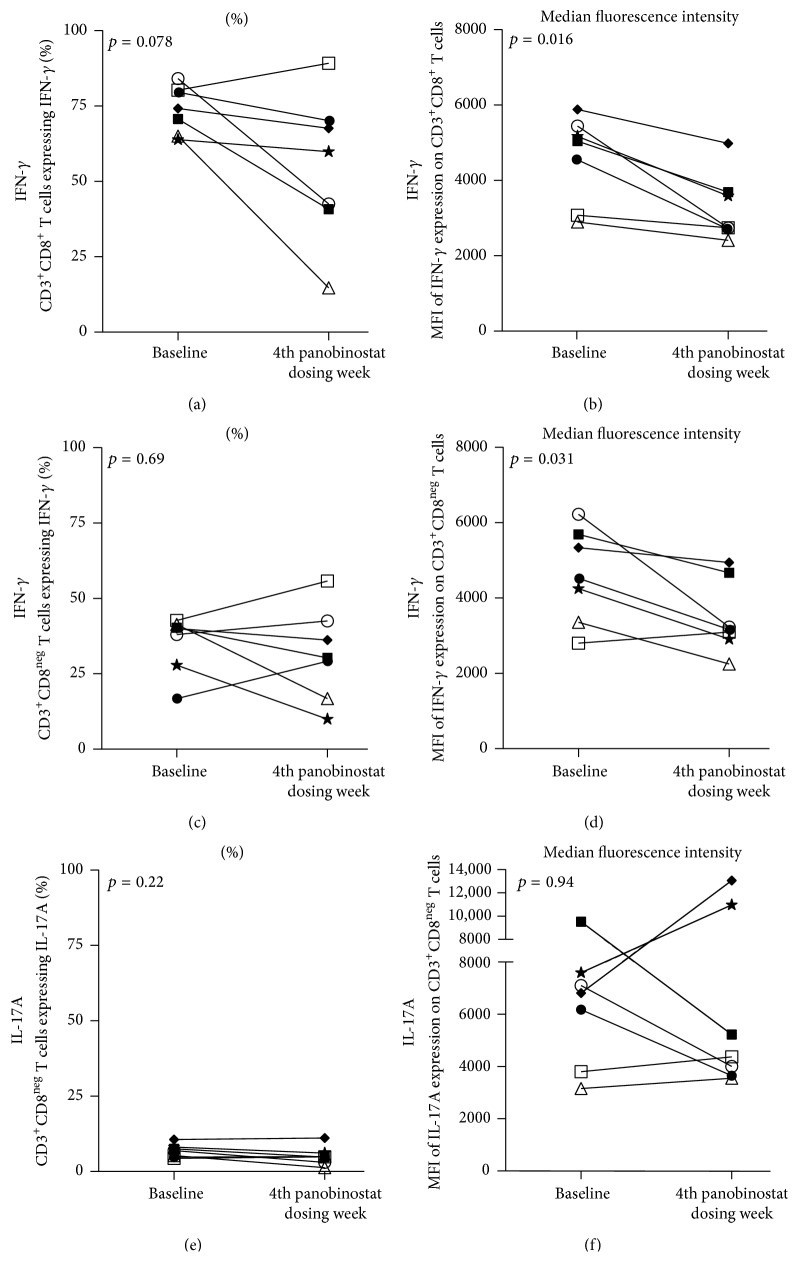
Figure 3.
Intestinal T cells exhibit reduced intracellular IFN-γ expression following ex vivo stimulation. (a–f) LPMCs were stimulated ex vivo with PMA/ionomycin and then assessed for intracellular cytokine expression. Intestinal CD8+ T cells (a and b) and CD8neg T cells (c–f) were assessed for INF-γ (a–d) or IL-17A (e and f) expression. The proportion of cells expressing the respective cytokine is graphed in the left column while the levels of cytokine expression are represented in the right column. Patient × and Patient ▲ were excluded from the intracellular cytokine expression analyses due low cell yields that precluded performance of the ex vivo stimulation either at the “baseline” or “during panobinostat” time point, respectively. Each patient participant is represented in all figures by the same distinct symbol. Wilcoxon matched-pairs signed rank tests were used to generate the reported p values.

