Figure 1.
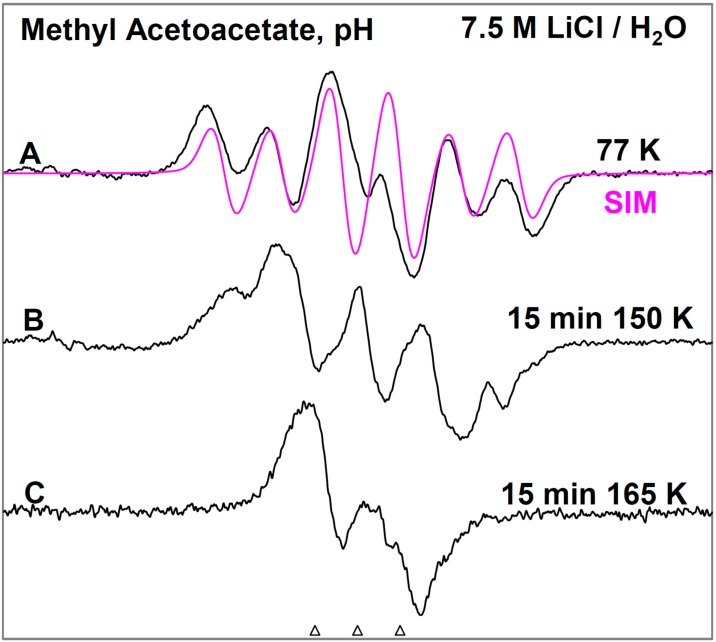
ESR spectra of the prehydrated electron addition to MAA at 77 K and subsequent reactions of the MAA anion radical on annealing to 165 K in a 7.5 M LiCl H2O glass. (A) The black spectrum of the protonated MAA anion radical (radical II). The pink spectrum is the simulated spectrum of radical II. For simulation parameters, see text; (B) Radical II, after conformational rearrangement; (C) Radical III, CH3-CO-C•H-CO-OCH3, formed by H-atom abstraction from the parent MAA molecule by radical II at 165 K. The three reference markers (open triangles) in this figure and in the subsequent figures show the position of Fremy’s salt resonance with the central marker at g = 2.0056. Each of these markers is separated from each other by 13.09 G.

