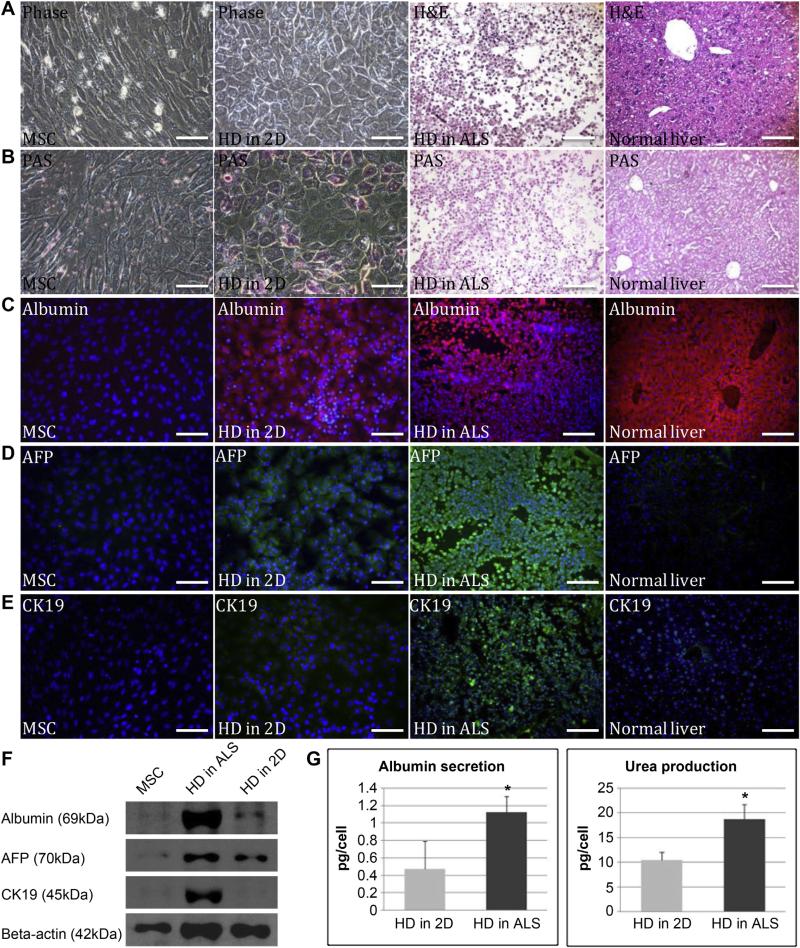
Fig. 5.
In vitro analysis of liver function markers. (A) Phase of hepatic differentiation of MSCs using the 2D and ALS approaches compared to normal liver. (B) PAS staining showed the glycogen storage capability after four weeks of hepatic differentiation using the 2D and ALS approaches. (C)(D)(E) Immunofluorescence analysis of albumin (red), AFP (green) and CK19 (green) expression in undifferentiated MSCs and after four weeks of hepatic differentiation using the 2D and ALS approaches. (F) Western blot analysis showed the expression of albumin, AFP and CK19 in undifferentiated MSCs and after four weeks of hepatic differentiation using the 2D and ALS approaches. (G) Albumin secretion (P = 0.015) and urea production (P = 0.019) after hepatic differentiation for four weeks using the 2D and ALS approaches. Data are presented as means ± SD from three independent experiments (*, P < 0.05). Scale bar: 100 μm. (For interpretation of the references to color in this figure legend, the reader is referred to the web version of this article.)

