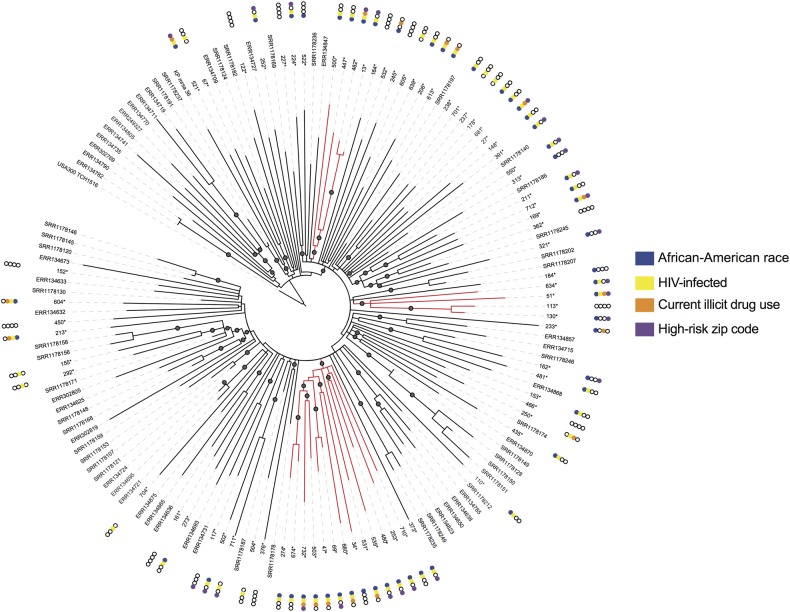
Figure 3.
Maximum-likelihood phylogenetic analysis of USA300 methicillin-resistant Staphylococcus aureus transmission networks in our urban study population relative to other US cities. Note: Asterisk indicates isolates from current study. Gray circles indicate >90% confidence by bootstrap analysis. Isolates highlighted in red indicate those belonging to identified transmission networks. Abbreviation: HIV, human immunodeficiency virus.

