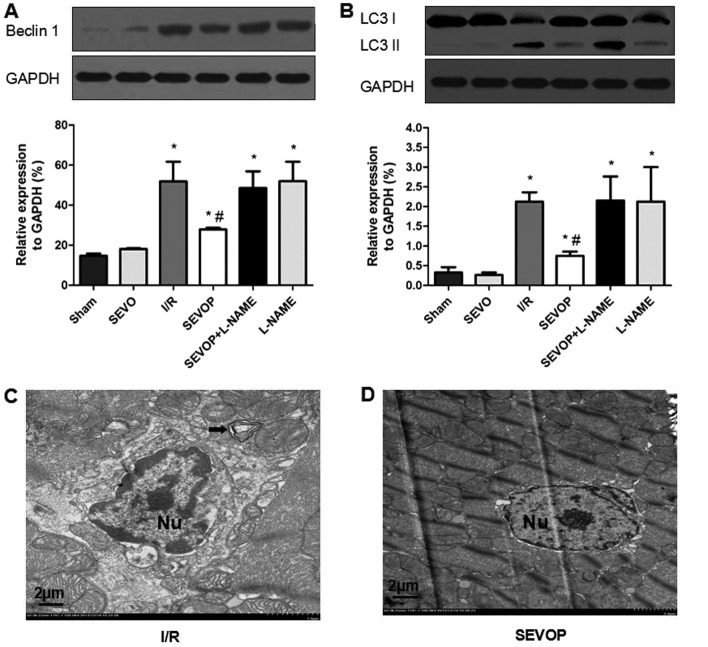
Figure 5.
Alterations in LC3-II/I and Beclin-1 expression following sevoflurane post-conditioning. Shown are myocardial western blots of LC3-II/I and Beclin-1 expression. (A and B) Representative western blots of Beclin-1 and LC3II/I, respectively, in the Sham, SEVO, I/R, SEVOP, SEVOP + L-NAME and L-NAME groups. Values are expressed as the means ± SD (n=5 experiments). A one-way ANOVA followed by Tukey's post-hoc test was used to determine statistical significance. *P<0.05 vs Sham. #P<0.05 vs I/R. (C and D) Representative transmission electron microscopy images from the I/R and SEVOP groups, respectively (original magnification, ×2,000; scale bar, 2 µm), showing that the number of autophagic vacuoles (AVs) decreased in the sevoflurane post-conditioning group when compared with the I/R group. (C) Arrow indicates autophagic vacuole. Sham, sham-operated group; SEVO, sevoflurane group (no I/R injury); I/R, ischemia/reperfusion injury group; SEVOP, sevoflurane post-conditioning group; L-NAME, group treated with NG-nitro-L-arginine methyl ester (NOS inhibitor); Nu, nucleus.

