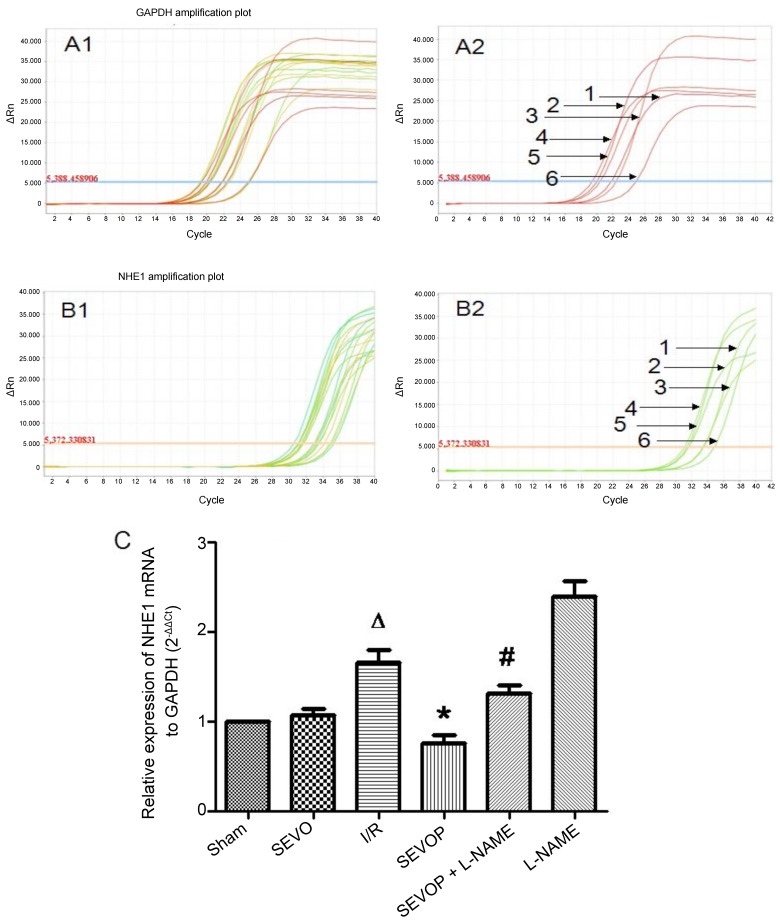
Figure 7.
Sevoflurane post-conditioning inhibits NHE1 mRNA expression. (A1) Representative amplification plot of GAPDH; 3 microwells/group, 6 groups; 3 different colors indicate 3 microwells. (A2) Representative amplification plot of GAPDH for 6 groups. Numbers 1, 2, 3, 4, 5 and 6, represent the amplification plot of GAPDH for the Sham, SEVO, I/R, SEVOP, SEVOP + L-NAME and L-NAME groups, respectively. (B1) Representative amplification plot of NHE1; 3 microwells/ group, 6 groups; 3 different colors indicate 3 microwells. (B2) Representative amplification plot of NHE1 for 6 groups. Numbers 1, 2, 3, 4, 5 and 6, represent the amplification plot of NHE1 for the Sham, SEVO, I/R, SEVOP, SEVOP + L-NAME and L-NAME groups, respectively. (C) mRNA expression of NHE1 relative to GAPDH, in the Sham, SEVO, I/R, SEVOP, SEVOP + L-NAME and L-NAME groups, respectively. Values are expressed as the means ± SD (n=3). A one-way ANOVA followed by Tukey's post-hoc test was used to determine statistical significance. ΔP<0.05 vs. Sham, *P<0.05 vs. I/R, #P<0.05 vs. SEVOP..

