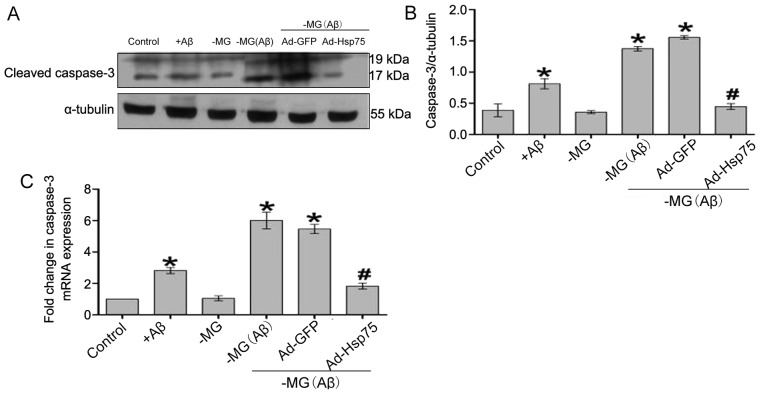
Figure 9.
The level of caspase-3 was analyzed by western blot analysis and RT-qPCR. (A) Western blot analysis of caspase-3 and α-tubulin protein expression in neural stem cells (NSCs) following treatment. (B) Quantitative analysis of caspase-3 protein expression. The expression of the targeted protein was determined relative to the expression of α-tubulin protein. (C) RT-qPCR analysis of caspase-3 mRNA levels expressed in NSCs following treatment. The RT-qPCR experiments were performed in triplicate, and caspase-3 mRNA expression was normalized to the expression of β-actin. Data represent the means ± SEM. *p<0.05 compared to the control group; #p<0.05 compared to the NSC-microglial cells (NSC-MG cells; co-culture system) treated with β-amyloid peptide (Aβ)1–42 and the adenovirus green fluorescent protein (Ad-GFP) group. Three independent experiments were performed. Ad-Hsp75, adenovirus heat shock protein 75.

