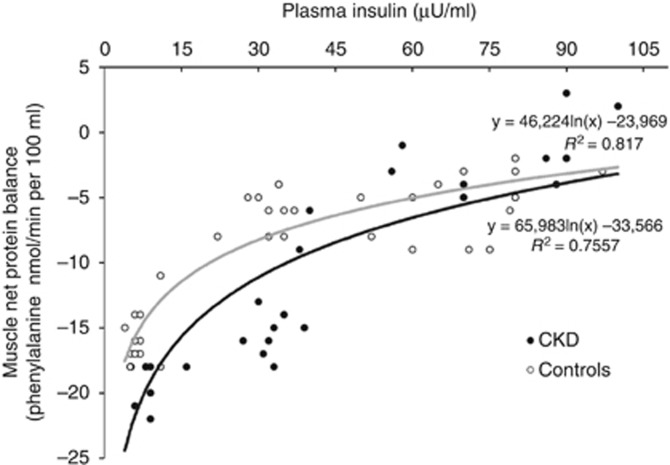
Figure 5.
Dose–response relationships between net protein balance across the forearm and insulin levels. To determine the dose–response characteristics for the effect of insulin on muscle protein metabolism, the net balance of phenylalanine across the forearm was plotted versus the corresponding steady-state plasma insulin concentrations (only the 100 and 120 min infusion data point considered) during insulin infusion. The fitted curve is a nonlinear least squares best fit to a logarithmic function. In control subjects, net protein balance decreased steeply from −17 nmol/min per 100 ml in the basal, postabsorptive state to −8 nmol/min per 100 ml when insulin concentrations were raised to 30 μU/ml. With further increases in insulin concentrations to ~100 μU/ml, net protein balance decreased only to −5 nmol/min per 100 ml. Thus, the maximal effect of insulin occurred at insulin concentrations between 15 and 30 μU/ml. In CKD patients the insulin response was shifted downward with higher net protein balance at moderate hyperinsulinemia. The curve of insulin sensitivity of protein balance in patients with chronic kidney disease (CKD) overlapped with the same curve obtained in controls in the high insulin physiological range.

