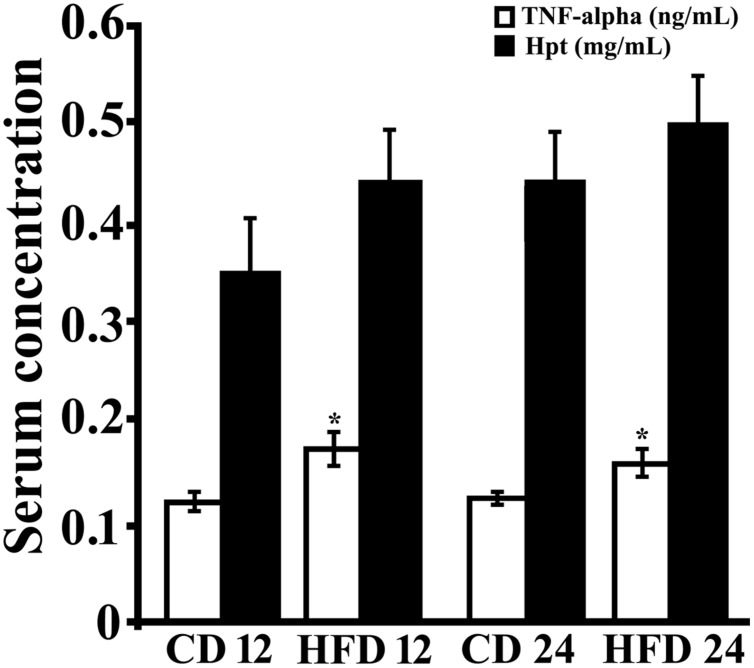
FIGURE 1.
Serum level of inflammation markers. TNF-alpha (open bar) and Haptoglobin (Hpt; black bar) concentrations were measured by ELISA in serum of rats fed high-fat diet (HFD) or standard diet (control diet, CD) for 12 (CD 12, N = 8; HFD 12, N = 6) or 24 (CD 24, N = 7; HFD 24, N = 7) weeks. Each sample was analyzed in triplicate. Data were expressed as ng/ml (TNF-alpha) or mg/ml (Hpt), and reported as mean ± SEM. Significant differences between groups are indicated (∗, values significantly different from control by Student’s t-test, p < 0.05).

