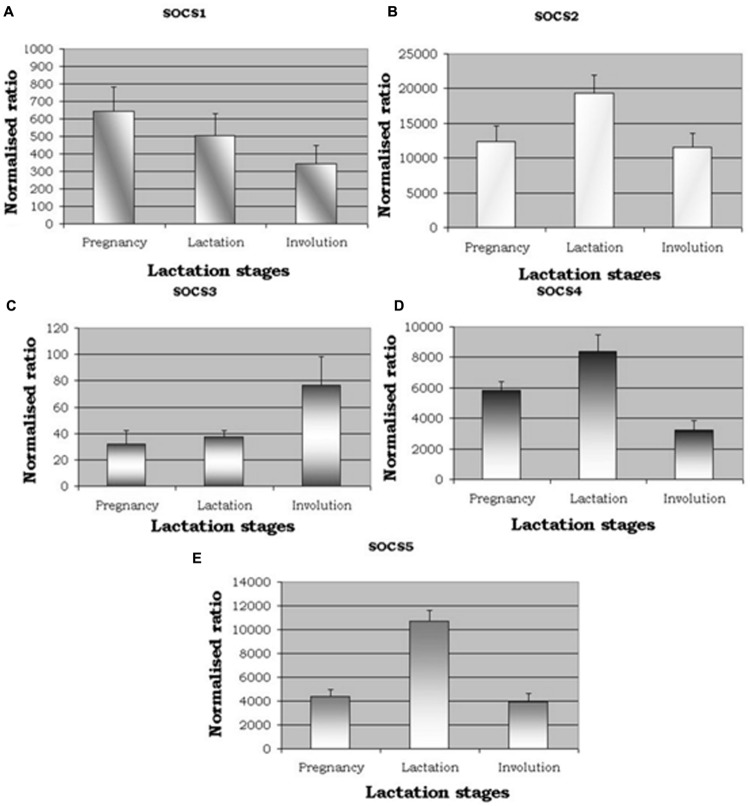
FIGURE 1.
qRT-PCR expression for suppressors of cytokine signalling (SOCS). (A–E) show expression of SOCS1, SOCS2, SOCS3, SOCS4, and SOCS5. Normalized ratios showing altered expression for five members of SOCS genes across the three distinct lactation stages, namely pregnancy, lactation, and involution. P-values were significant between lactation stages for [SOCS2, P = 0.057 (suggestive); SOCS4, P = 0.007); SOCS5, P < 0.001].

