FIGURE 3.

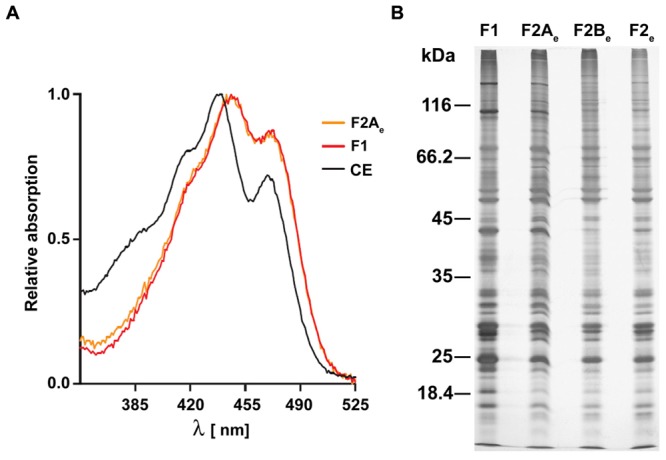
Spectral analysis and SDS-PAGE of the different eyespot fractions. (A) Normalized absorption spectra of fractions F1 and F2Ae in 90% methanol in comparison to that of a crude cell extract (CE). (B) Comparison of the protein patterns of fractions F1, F2Ae, F2Be, and F2e. Total proteins (10 μg) of the different gradient fractions were separated by SDS-PAGE (11%) and stained with silver. The positions of molecular mass markers are indicated on the left in kilodaltons.
