Figure 1.
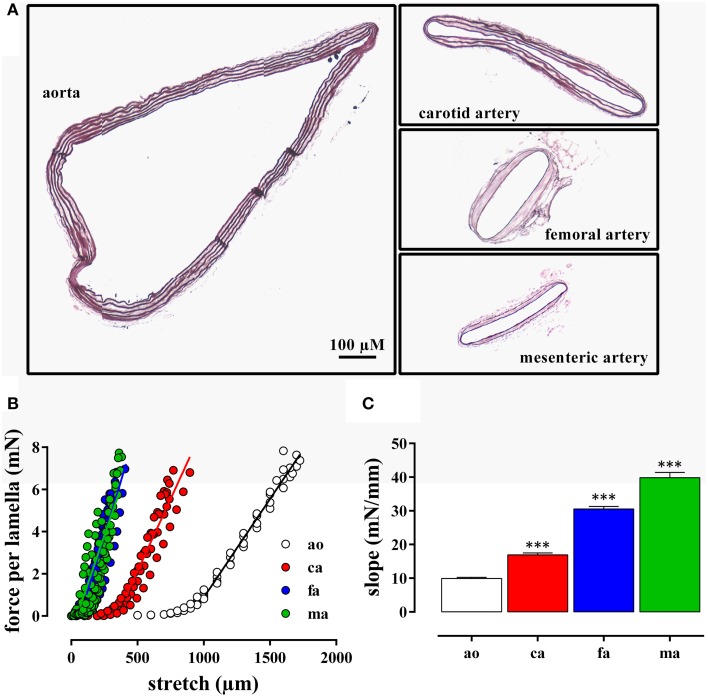
(A) Transverse sections through segments of the aorta, the carotid artery, the mesenteric artery, and the femoral artery from the same mouse. The segments were mounted in the myograph for 8 h and transverse sections were stained with orcein to show the elastin layers in the different blood vessels. (B) Force per lamella as a function of stretch for the aorta (ao, n = 4), the carotid artery (ca, n = 6), the femoral artery (fa, n = 8), and the mesenteric artery (ma, n = 8). (C) Slope of the linear part of the different force-stretch relationships shown in (B). All slopes were significantly (***P < 0.001) different from each other.

