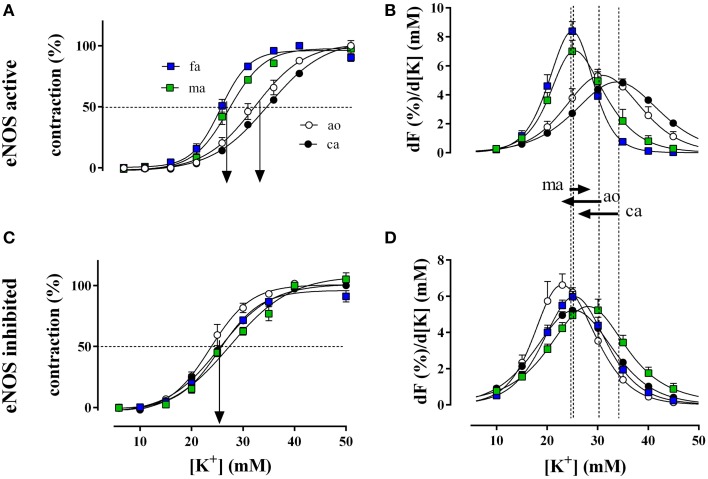
Figure 3.
Relative isometric contractions of the aorta (ao, n = 4), the carotid artery (ca, n = 6), the femoral artery (fa, n = 6), and the mesenteric artery (ma, n = 5) by increasing K+ concentrations (depolarization) in the presence and absence of basal NO (A,C, respectively). Basal NO release was inhibited by incubation with 300 μM L-NAME. The first derivative of the individual concentration-response curves of (A,C) are displayed in (B,D) and correlate with window contraction curves because of L-type Ca2+ influx (Fransen et al., 2012a,b). The dashed lines correspond with the EC50 of K+ or the maximal change of relative tension per concentration of K+ with eNOS active, whereas the arrows between (B) and (D) indicate the shifts of the concentration-contraction curves after inhibition of eNOS with L-NAME for aorta (ao), carotid artery (ca), and mesenteric artery (ma). A shift was absent in fa.

