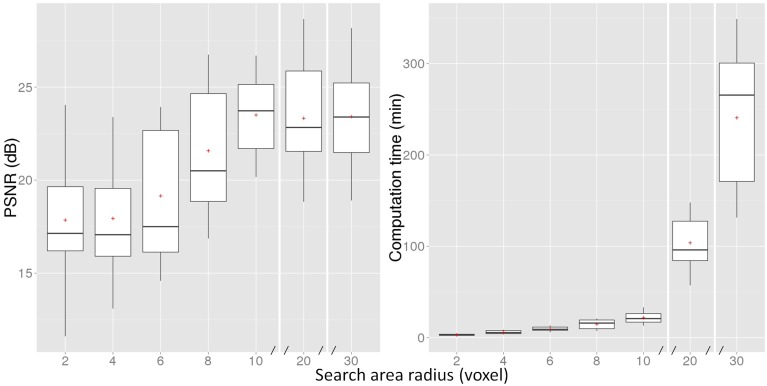
Figure 3.
PSNR measure and computation time of the proposed NLM method for different search area radii. The boxes represent the lower and upper quartile with the median as the central black line and the mean with a red cross. The whiskers extend to the most extreme data point. Note that the x-axis is discontinuous after 10 voxels.

