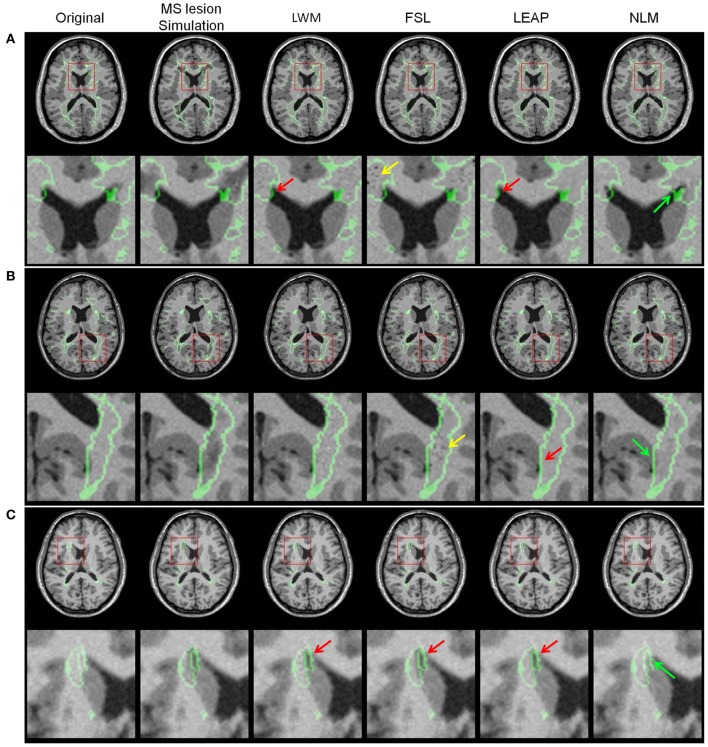
Figure 5.
Lesion simulation examples with the original image, MS lesion simulation and the different lesion filling results LWM, FSL, LEAP, and NLM for three different lesion sizes [(A) = large, (B) = medium and (C) = small]. The red arrows point to anatomically improbable lesion filling results, the yellow arrows point to intensity problems while the green arrows point to plausible and realistic anatomy. The original lesion boundary and the red square on the axial image depicts the zoom-in image region shown below it. Note that these images were generated at β0.

