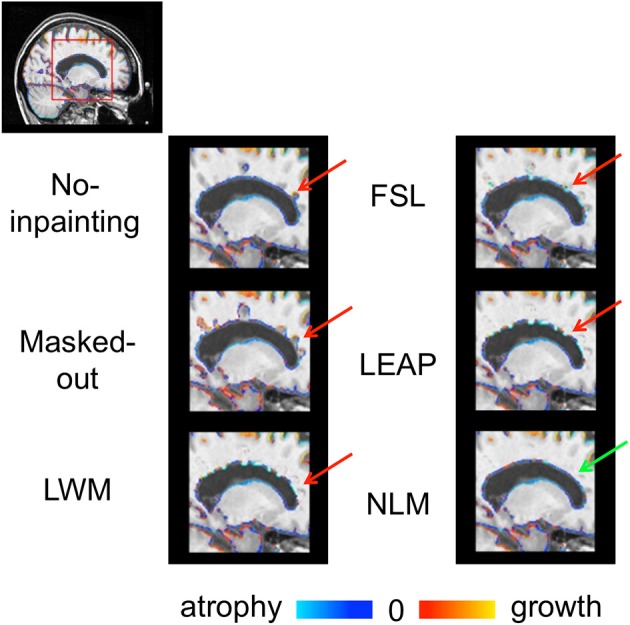
Figure 8.

SIENA brain boundary changes (atrophy = blue and growth red) of the “original” images and with the different strategies to account for lesions (Masked-out, LWM, FSL, LEAP, and NLM). The red arrows point to anatomically improbable boundary changes while the green arrow points to plausible and realistic boundary changes.
