
FIGURE 1.
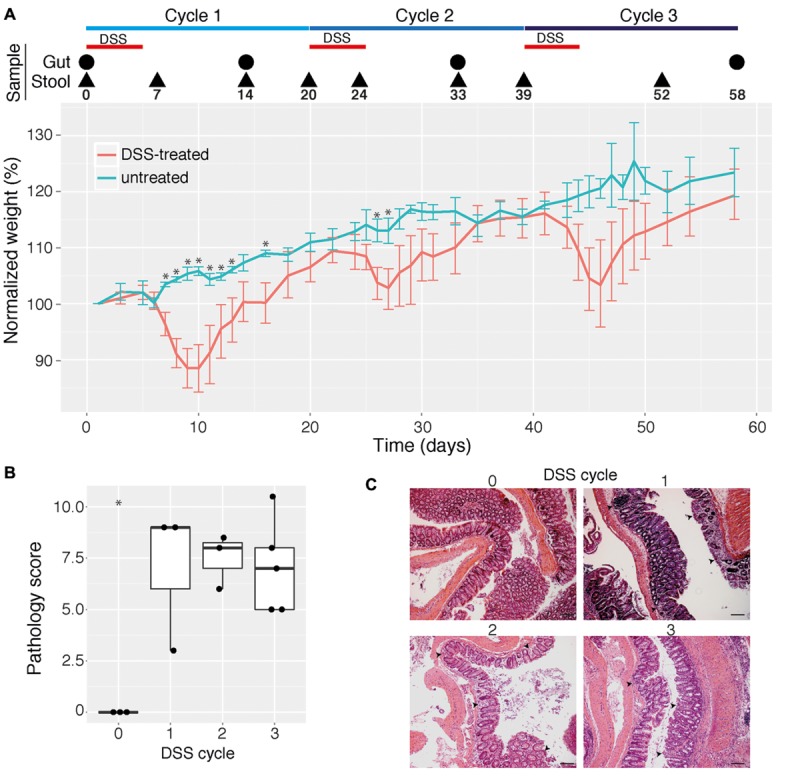
Effect of multiple cycles of dextran sodium sulfate (DSS) treatment in mice. (A) Mean change in weight (in percent) for mice given three cycles of 2% DSS in drinking water (indicated by red horizontal bars) as well as untreated control mice (n = 3–11 for each data point). Mice were sampled for intestinal (cecum and colon) contents and pathology analysis as well as for stool analysis at selected time points (indicated by a circle or triangle, respectively, and the day number). Error bars indicate 95% confidence interval and asterisks indicate days where for which there is a statistically significant difference in weights between control and treatment groups (p < 0.05, corrected for multiple comparisons). Weight dynamics for individual mice are shown in Supplementary Figure S1. (B) Pathology scores of colon mucosal tissue from mice give 0, 1, 2, or 3 cycles of DSS. Pathology scores were calculated as the sum of inflammation severity and extent, crypt depth, and area of inflammation, as determined by an experienced pathologist. Asterisk indicates statistically significant difference compared with all other groups (p < 0.05). (C) Representative photomicrographs (10× magnification) of hematoxylin and eosin-stained colon tissues obtained from untreated and DSS-treated mice. Black scale bars are 200 μm. Arrows indicate infiltrates of immune cells.