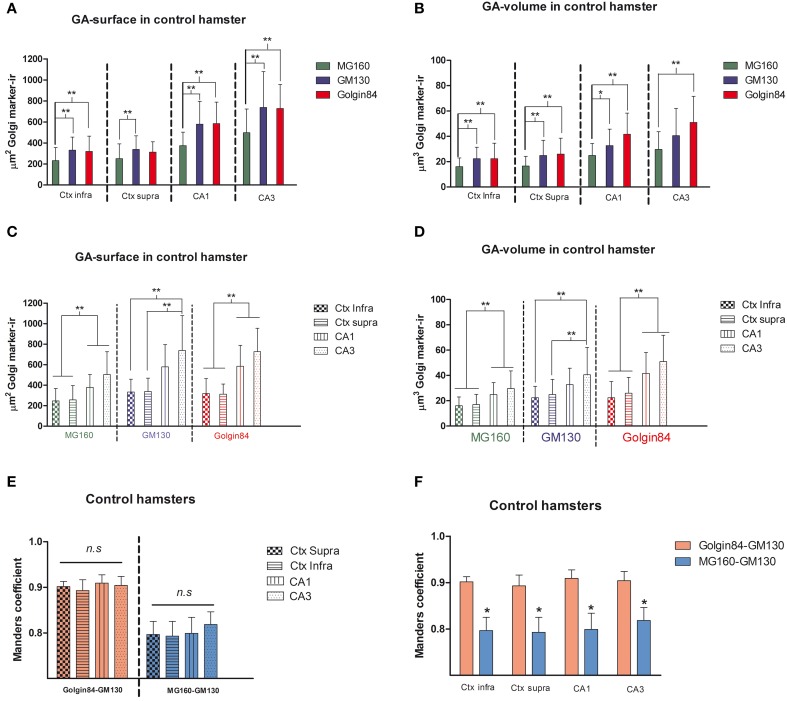
Figure 2.
(A–D) Histograms showing surface area (A,C) and volume (B,D) values (mean ± SD) of GA elements immunoreactive for MG160, GM130, and Golgin84, obtained from cropped confocal image stacks (n > 15 in all cases) including complete single pyramidal neurons from supra and infragranular neocortical layers and CA1 and CA3 hippocampal regions. (A,B) Show the statistical comparisons between mean values (surface area and volume respectively) obtained with the different Golgi markers within each brain region. (C,D) Show the comparisons of the values obtained with each marker across the different brain regions. (Kruskall-Wallis, *p ≤ 0.01; **p ≤ 0.001). (E,F) Show comparisons across the different brain regions and within each brain region, respectively, of the mean values of Manders colocalization coefficient obtained for MG160/GM130 and Golgin84/GM130. Values for each marker combination and region were obtained from every image confocal plane of cropped image stacks corresponding to 15 fully reconstructed neurons. Kruskall-Wallis test found significant differences in the comparisons of every possible combination of mean values (p ≤ 0.001).

