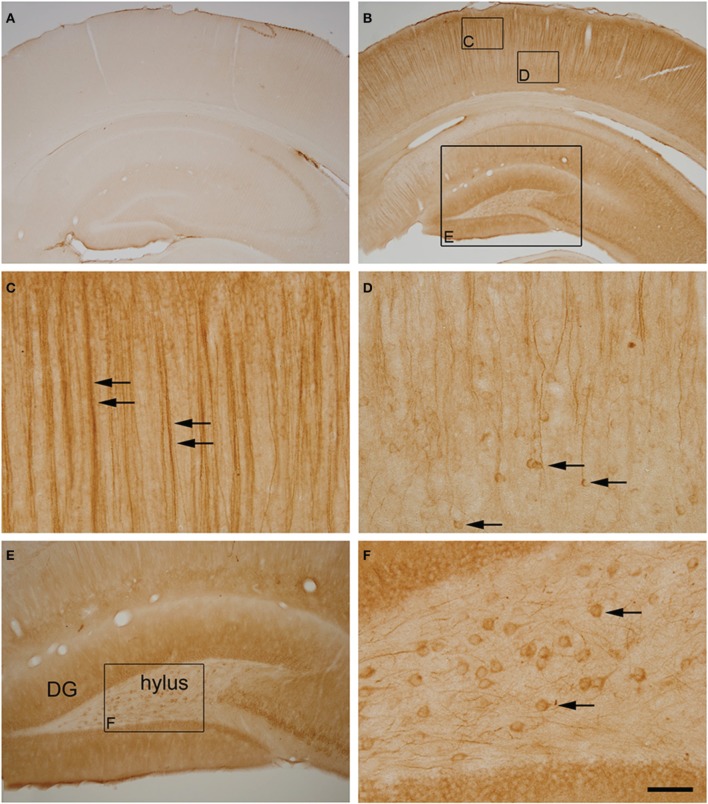
Figure 7.
(A,B) Photomicrographs showing the patterns of hyperphosphorylated tau immunostaining (AT8 antibody) in the neocortex and hippocampus of control (A) and torpid (B) Syrian hamsters. Small squared zones in (B) are shown at higher magnification in (C,D). Note the AT8 immunostaining of layer V neuronal cell bodies (arrows in D) and their apical dendrites in layer III (arrows in C). The large squared zone in (B) and squared zone in (E) are shown at higher magnification in (E,F), respectively. Note the intense AT8 immunostaining in hylar neurons (arrows in F). Scale bar in F indicates 570 μm in (A,B), 57 μm in (C,D,F) and 115 μm in (E).

