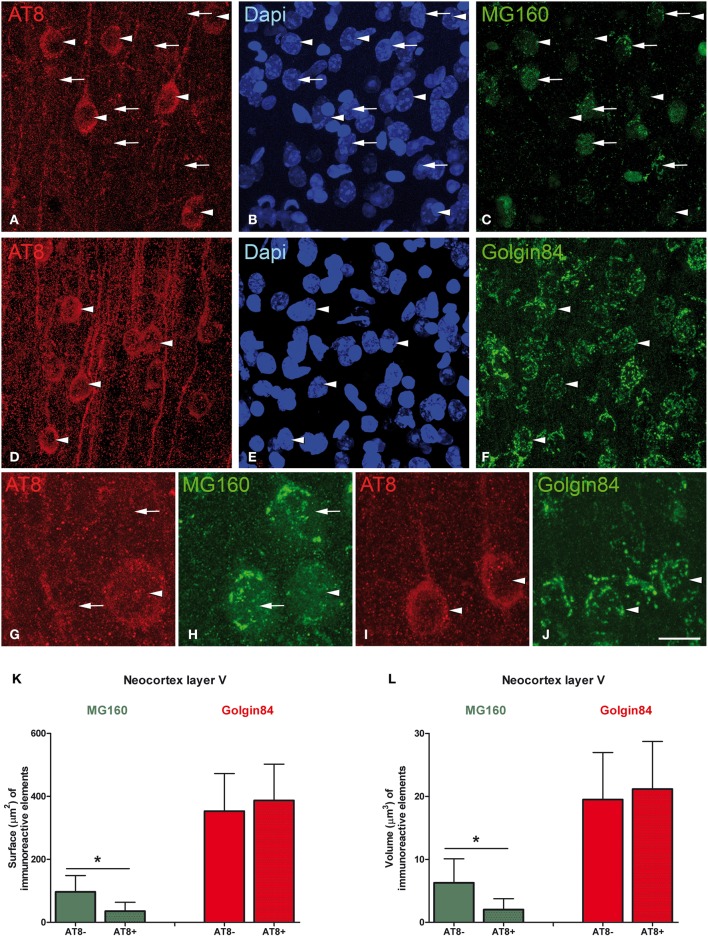
Figure 8.
Microphotographs taken from layer V of the somatosensory cortex from Syrian hamsters in torpor state. Sections were double stained with antibodies directed against AT8 and MG160 (A–C,G,H), and against AT8 and Golgin84 (D–F,I,J), counterstained with Dapi. Arrowheads indicate AT8 positive neurons whereas arrows indicate adjacent AT8 negative neurons. Note the marked reduction in MG160 immunostaining of the GA in AT8+ neurons and the similar pattern of Golgin84 immunostaining between AT8+ and AT8− neurons. Histograms show surface area (K) and volume (L) values (mean ± SD) of GA elements immunoreactive for MG160 and Golgin84 in AT8+ cells and in AT8− cells. Wilcoxon test found significant differences in the comparisons between AT8+ and AT8− cells in both volume and surface area values of MG160-ir (*p ≤ 0.001) but not Golgin84-ir elements. Scale bar in (J) indicates 20 μm in (A–F), 7 μm in (G,H) and 10.5 μm in (I,J).

