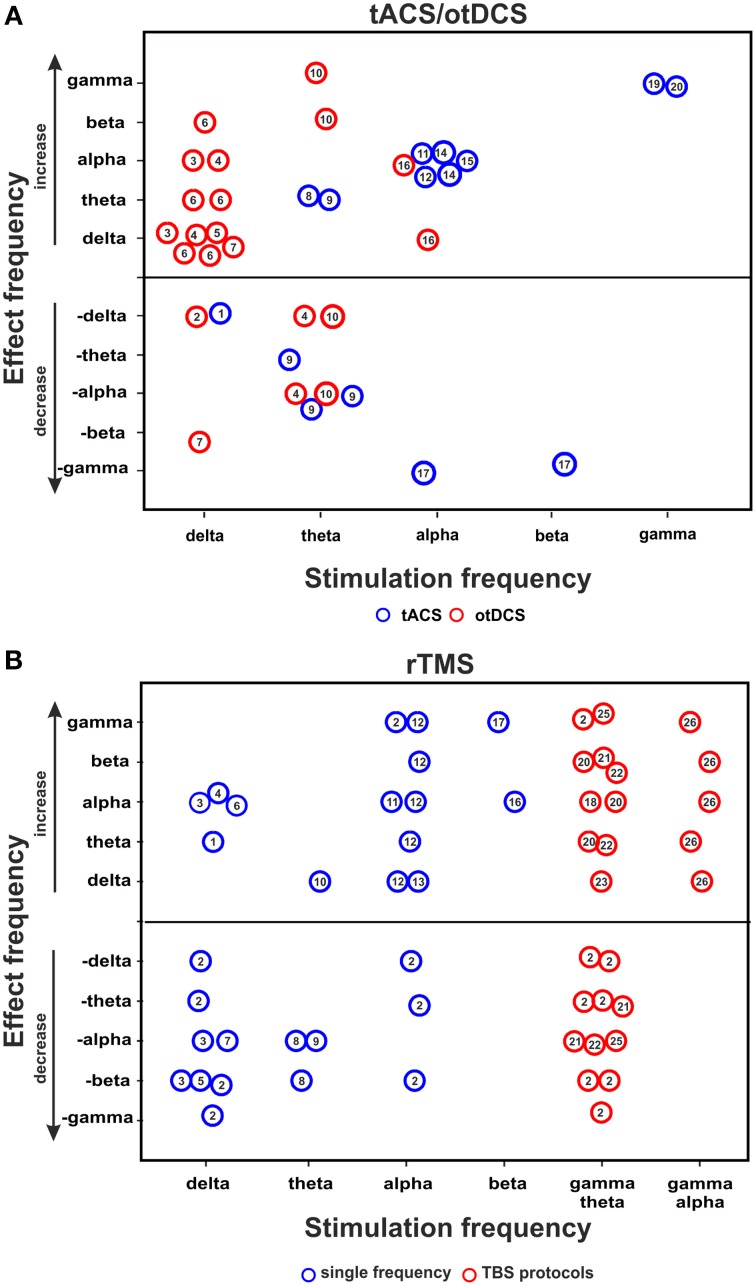
Figure 1.
tACS/otDCS and rTMS aftereffects on brain oscillation. Relationship between stimulation frequency and effect frequency as inferred from (A) combined tACS/otDCS-EEG/MEG studies, and (B) combined rTMS-EEG/MEG studies. The figure collapses across EEG measures used (power or coherence). Each circle represents a reported effect (refer to data in Tables 1, 2 for tACS/otDCS and rTMS, respectively). Numbers in circles correspond to the respective study ID in the leftmost column in the relevant table. Circles above the horizontal line indicate a power/coherence increase, circles below the line indicate a power/coherence decrease. Null effects are not included; consequently this figure over-represents positive results.

