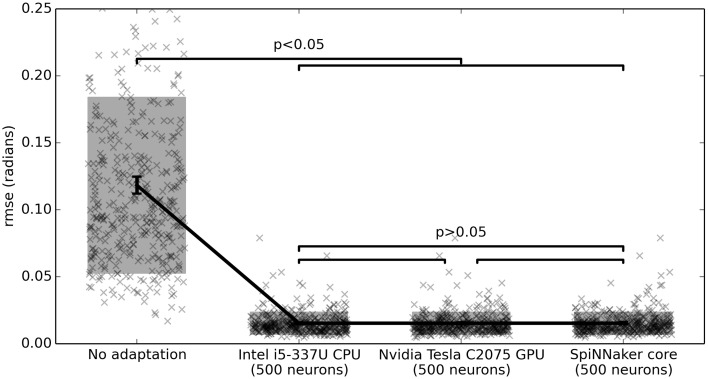
Figure 5.
Benchmark results comparing three hardware systems. Each system is running 500 neurons. The hardware do not statistically significantly differ, but are all statistically significant improvements over no adaptation (p < 0.05; two-tailed t-test with Bonferroni correction; 400 samples per condition). Scatterplots show individual runs (with random jitter on the x-axis to avoid overlap), the shaded area is the mean plus or minus the standard deviation, and the 95% confidence interval of the mean is shown.

