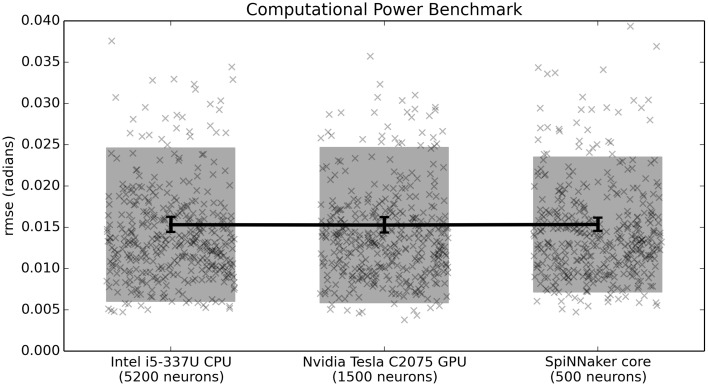
Figure 6.
Benchmark results comparing three hardware systems in terms of their performance when running as many neurons as they are capable of in real time. Scatterplots show individual runs (with random jitter on the x-axis to avoid overlap), the shaded area is the mean plus or minus the standard deviation, and the 95% confidence interval of the mean is shown. In this case, there is no statistical difference between the three hardware systems (p > 0.05; two-tailed t-test with Bonferroni correction; 400 samples per condition).

