Figure 2.
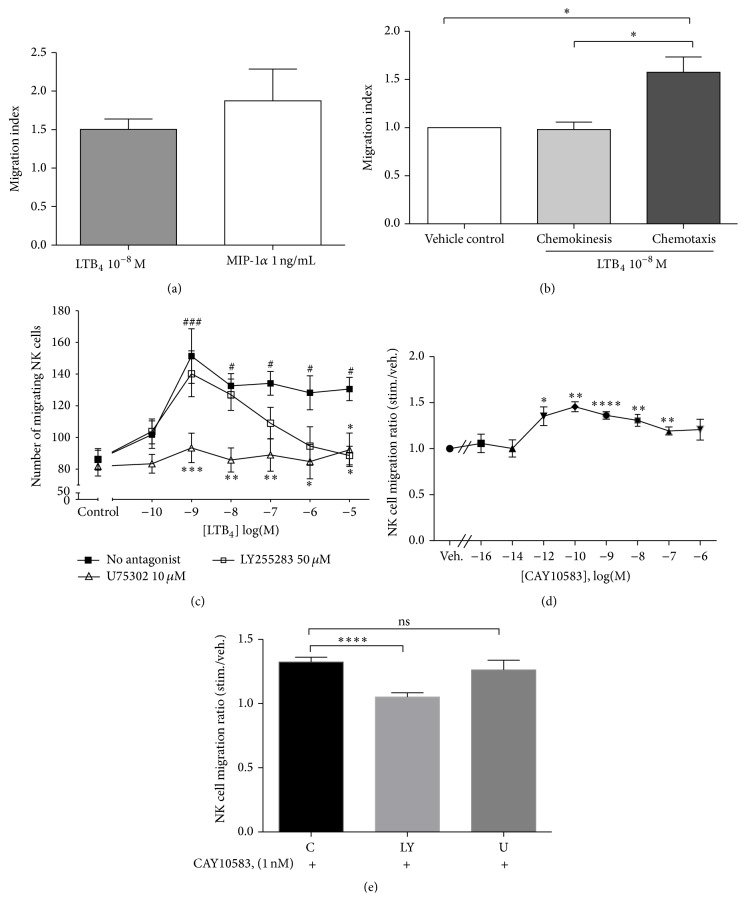
NK cell migration in response to LTB4. (a) Bar graphs represent NK cell migration in response to MIPα, 1 ng/mL, and LTB4, 10−8 M. (MI: migration index, number of cells migrating in response to stimulus divided by number of cells migrating in response to control medium. Graph represents mean ± SEM of four independent experiments.) (b) Results illustrate the comparison of chemokinesis and chemotaxis to 10−8 M LTB4. Spontaneous migration in the presence of vehicle alone (ethanol 0.0033%) was normalized to 1. Bar graphs represent means ± SEM of four independent experiments, ∗ P < 0.05 paired Student's t-test. (c) PBLs were preincubated without antagonist (■), with U75302 10 μM (∆) or LY255283 50 μM (□) for 30 minutes at 37°C, before a chemotaxis assay with graded concentrations of LTB4 or vehicle control. The number of migrating cells was measured by FACS, gating on the NK cell population (CD3− CD56+). Each curve represents mean ± SEM of five independent experiments. # P < 0.05, and ### P < 0.001 by one-way ANOVA with Dunnett posttest to vehicle control. ∗ P < 0.05, ∗∗ P < 0.01, and ∗∗∗ P < 0.001 by two-way ANOVA with Bonferroni posttests to no-antagonist data. (d) NK cell migration in response to graded concentrations of CAY10583. Data are expressed as means ± SEM of ratios of migrating cells in response to CAY10583 versus vehicle (n = 8), ∗ P < 0.05, ∗∗ P < 0.01, ∗∗∗ P < 0.001, and ∗∗∗∗ P < 0.0001. (e) NK cell migration in response to 10−9 M CAY10583 in the absence or presence of LY255283 (LY) or U75302 (U). ∗∗∗∗ P < 0.0001, n = 5.

