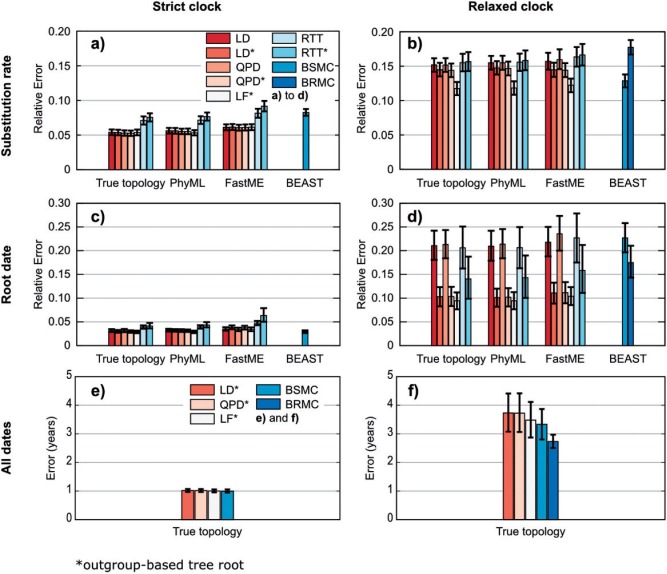
Figure 2.
Summary results with simulated data. Panels a), c) and e) contain summary results of the trees with a SMC, panels b), d) and f) those with a lognormal, RMC. Panels a) and b) show the relative error of the substitution rate estimates, panels c) and d) show the relative error of the root date estimates, panels e) and f) show the average error (in years) of the data estimates of all tree nodes. See text for the definitions of these measures. From left to right (see legends) tested methods are: linear dating with tree root estimation (LD); linear dating with outgroup-based tree rooting (LD*); quadratic programing dating with tree root estimation (QPD); quadratic programing dating with outgroup-based tree rooting (QPD*); Langley-Fitch that uses rooted trees only (LF*); root-to-type regression with tree root estimation (RTT); root-to-type regression with outgroup-based tree rooting (RTT*); BEAST with strict molecular clock (BSMC); BEAST with lognormal, relaxed molecular clock (BRMC).

