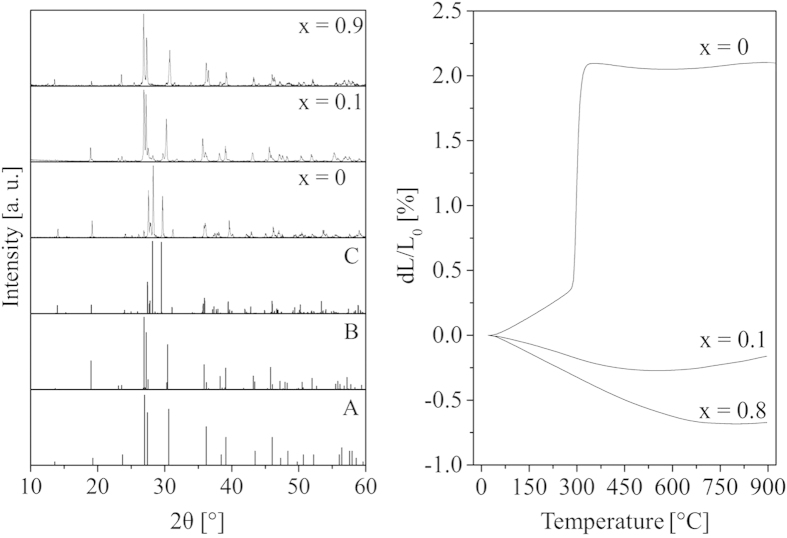
Figure 2. Changes in the crystal structure and the thermal expansion behavior in the solid solution series Ba1-xSrxZn2Si2O7 for different values of x.
On the left side, X-ray powder diffraction patterns measured at room temperature are presented. In the lower part of the graph, the peak positions, determined by Klasens et al. in 195711 (A), those calculated from the crystal structure of a Ba0.6Sr0.4Zn2Si2O7 single crystal (B) and those of LT-BaZn2Si2O7 taken from ref. 13 (C) are given. In the upper part, measured diffractograms with x = 0, 0.1 and 0.9 are shown. On the right side, the thermal expansion behavior, determined via dilatometry, is given for x = 0, 0.1 and 0.8. The curve of the sample with x = 0 was taken from Ref. 10.

